“Without big data analytics, companies are blind and deaf, wandering out onto the web like deer on a freeway.”- Geoffrey Moore.
The data analysts use several data analytics techniques to extract relevant and useful trends of a specific area. But here, some questions arise: what is data analysis, and why is there a need for data analysis. The systematic application of logical and statistical methods to explain the data scope, summarize the data representation using tables, images, and graphs, and modularize the data structure is called Data Analysis. For example: During the outbreak of the pandemic of Coronavirus, several hospitals face various difficulties with treating Coronovirus positive patients. Data analysis helps provide an effective analysis to monitor the machine (used to treat patients) to achieve useful results.
Now, another question: why is there a need for Data analysis. Well, data analysis plays an important role in the growth of the business. It is just a type of business intelligence that is utilized to achieve desired profits and make the best use of all available resources. Data analysis also helps in enhancing managerial operations and support the company or organization to grow at another level. For example: With the help of data analysis, a company can see and check the opportunities before the time. This helps in unlocking various options for both company and workers that benefit in earning more profit.
What are the different types of data analytics techniques?
Table of Contents
There are various kinds of data analytics techniques, but all depend on the variety of the data and the quantity of data collected. Each technique concentrates on data mining methods, taking of the new information, and practicing the data to change all the facts and figures in the best decision-making parameters. Hence, various data analytics techniques can be classified as:
Data analytics techniques depend on mathematics and statistics
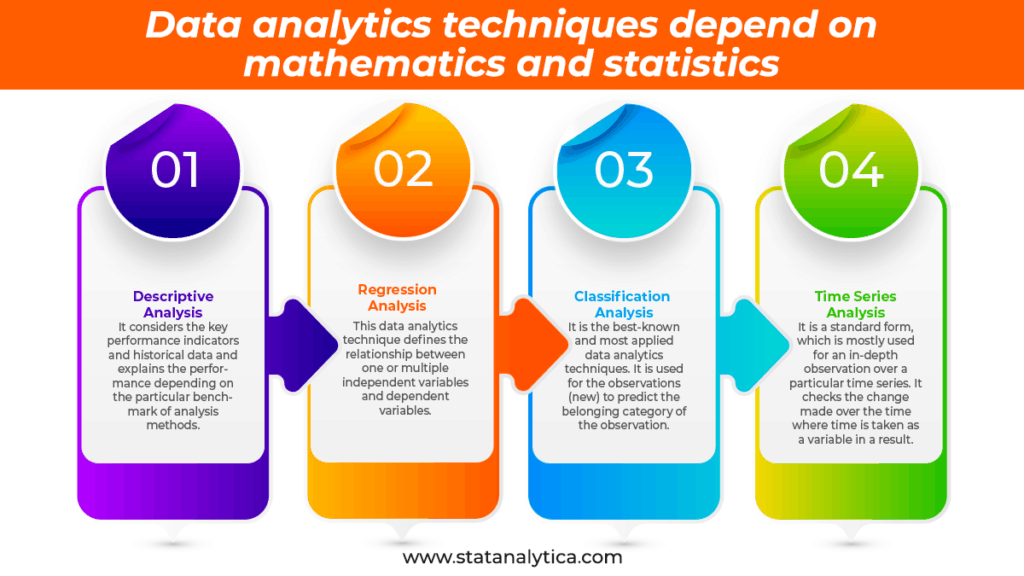
Descriptive Analysis
It considers the key performance indicators and historical data and explains the performance depending on the particular benchmark of analysis methods. Moreover, it analyzes past trends and the methods of how past trends can influence future performances.
For example, an insurance company collects its customer’s data to know various traits, such as customer’s age, agender, and nationality. The descriptive analysis helps the insurance company to get a better profile of each customer. Calculation of frequency helps in identifying the numbers of customers under a specific age; calculation of central tendency helps in identifying who the most customer are. More calculation of dispersion helps in identifying the variations, such as customer’s age; finally, the calculation of position helps in comparing customer’s segments depend on various traits.
Regression Analysis
This data analytics technique defines the relationship between one or multiple independent variables and dependent variables. The regressions model could be multiple, ridge, life data, linear, logistic, non-linear, or other.
For example: Assume you have a business of lemonade. You can use simple linear regression for determining the relationship between the temperature and revenue, with the help of sample size for revenue by considering it as a dependent variable. You can also determine the relationship between pricing, temperature, and workers’ numbers to the revenue in multiple variable regression. Hence, regressions analysis can help in analyzing the impact of varied parameters on business profits and sales.
Classification Analysis
It is the best-known and most applied data analytics techniques. It is used for the observations (new) to predict the belonging category of the observation. Classification is made with the help of analysis of historical observations of a known category. Several models use for classification, and one of the best and known model is a decision tree. The decision tree is the process that is used for answering yes or no questions to examine the category of the observation. This analysis technique is mostly used in combination along with the logistic regression that can easily enhance the prediction performance of the statistical model.
For example: In the healthcare sector, classification analysis is used to examine a new patient’s symptoms with the help of numerous patients’ historical data. The “classification” data analytics techniques are already utilized to predict cancer and discovering the high-risk groups.
Time Series Analysis
It is a standard form, which is mostly used for an in-depth observation over a particular time series. It checks the change made over the time where time is taken as a variable in a result. Here, you have to keep in mind that time is not a single parameter that is included in a measurement, but it is one of the primary axes on which the data is observed. There is a difference between another analysis and time series analysis, and that is the observation, or the data is gathered over a particular interval of time. It helps in identifying systemic trends, seasonal variances, and cycles of the observed data.
For example, A sales team of an organization analyzed an updated dashboard and observed that their predicted sales for the forthcoming game were much lower than normal. Approximately a week before the launch of the game, the team made a strategy to increase the sale of the ticket. The team developed a marketing strategy few days before the launch. Here they used time series analysis and created a promotional ticket offer on Father’s Day to increase the sales of the game. This helped them a lot in the increment of the game’s sale.
Data analytics techniques depend on Visualization and Graphs
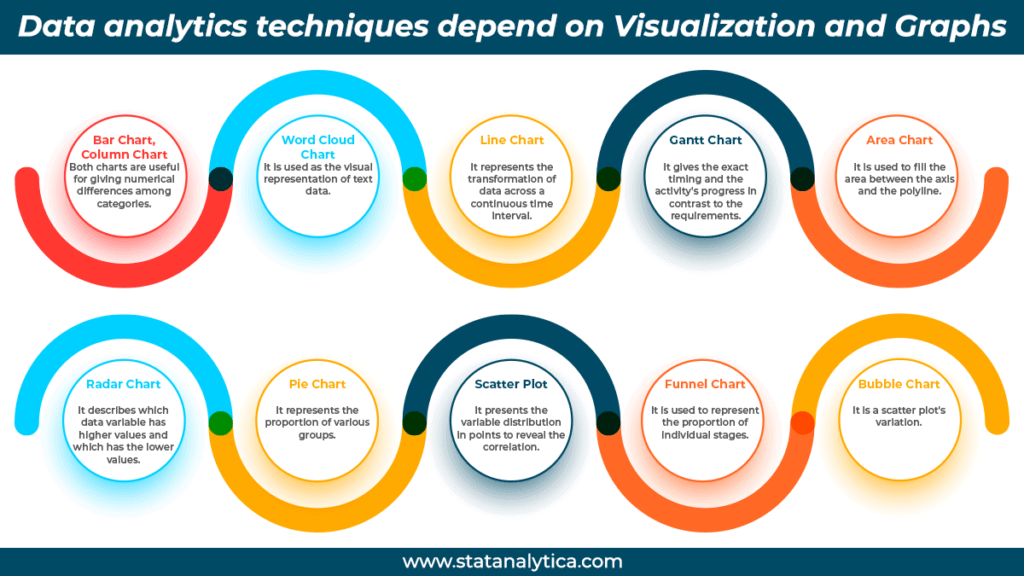
| Bar Chart, Column Chart | Both charts are useful for giving numerical differences among categories. |
| Word Cloud Chart | It is used as the visual representation of text data. This chart needs a large data and the discrimination’s degree. |
| Line Chart | It represents the transformation of data across a continuous time interval. |
| Gantt Chart | It gives the exact timing and the activity’s progress in contrast to the requirements. |
| Area Chart | It is used to fill the area between the axis and the polyline with color to represent better trend data. |
| Radar Chart | It describes which data variable has higher values and which has the lower values. Moreover, it uses to compare various quantized charts. |
| Pie Chart | It represents the proportion of various groups. It is mostly used for only one data series. |
| Scatter Plot | It presents the variable distribution in points to reveal the correlation among the rectangular coordinate system variables. |
| Funnel Chart | It is used to represent the proportion of individual stages and reflects the individual module’s size. It also supports ranking comparison. |
| Bubble Chart | It is a scatter plot’s variation. Here, the bubble area can be represented as the 3rd value. |
Data analytics techniques depend on Artificial Intelligence and Machine Learning
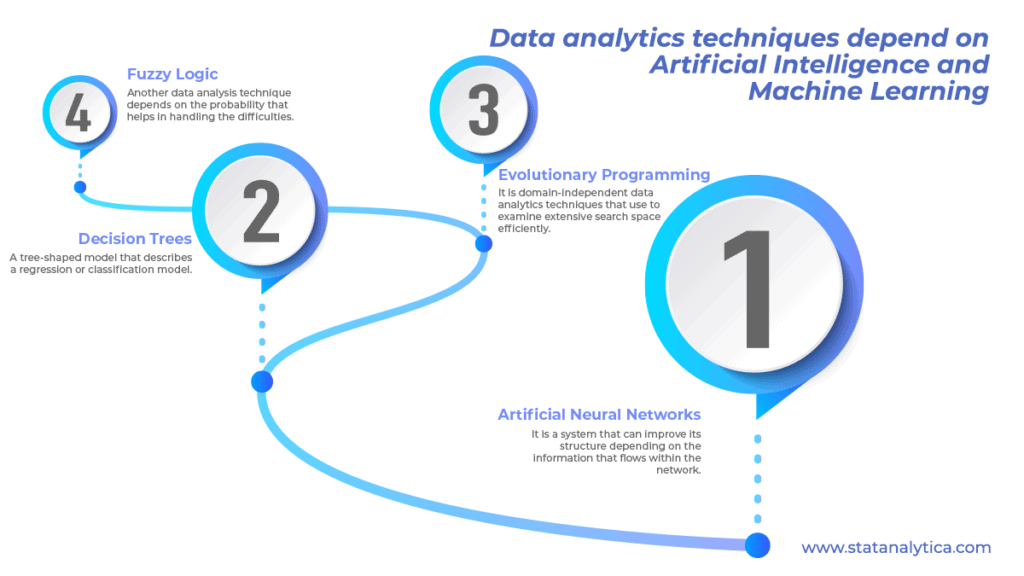
| Artificial Neural Networks | It is a system that can improve its structure depending on the information that flows within the network. It considers being highly dependable in forecasting applications and business classification. |
| Decision Trees | A tree-shaped model that describes a regression or classification model. It distributes the data sets into smaller subsets and develops in a similar decision tree simultaneously. |
| Evolutionary Programming | It is domain-independent data analytics techniques that use to examine extensive search space efficiently. |
| Fuzzy Logic | Another data analysis technique depends on the probability that helps in handling the difficulties in data mining techniques. |
Conclusion
It has been observed that many data analysts keep experimenting with different data analytics techniques to develop accurate data models. But, it is not possible to say or predict which data analytics technique would be the best to give the solutions to the challenging research questions. Therefore, it is always necessary for all data scientists to analyze various techniques based on the collected data type. Moreover, the data scientist can use various data analysis tools and software to determine the appropriate details by considering the scope of work, economic feasibility, infrastructure limitations. and get the best data analysis assignment from our experts.