

Before we start explaining SPSS and its uses, we need to know that SPSS stands for Statistical Package for the Social Sciences. SPSS is the name of a collection of data analysis software products. Its primary selling point is SPSS for data analysis, which enables academics to study data without the need for advanced statistical analysis. Various scholars utilize SPSS for advanced statistical data analysis. SPSS was launched in 1968, and IBM later acquired it in 2009.
Although it is officially known as IBM SPSS Statistics, most users still refer to it as SPSS. The software prioritizes simplicity over a more comprehensive and complex set of features and tools. So, this is the basics of SPSS. In this blog, we will discuss, and you will get to know all the details that help us learn more about SPSS software and SPSS for data analysis.
What is SPSS Software, and why do we need it?
Table of Contents
SPSS (Statistical Package for the Social Sciences) is a collection of software packages combined into a single package. This program’s primary function is to examine scientific data connected to social science. This information can be used for market research, surveys, data mining, and other purposes.
Researchers may quickly understand the market demand for a product using the statistical information acquired, which helps them adjust their strategy accordingly. SPSS basically stores and organizes the input data before compiling the data set to provide appropriate output. It is built to handle a wide range of variable data formats.
Due to its ease of use, versatility, and scalability, it is available to users of all skill levels. Furthermore, it is suitable for projects of all sizes and stages of complexity, and it may assist you and your business in identifying new opportunities, improving efficiency, and reducing risk. SPSS for Data analysis is also important for these projects.
With the help of SPSS, you can do various analyses.
- Because of its user-friendly interface, you can analyze and better comprehend your data, as well as solve complicated business and research problems.
- Understand vast and complicated data sets easily using powerful statistical processes that help in decision-making accuracy and quality.
- To interact with open source applications, use extensions, Python, and R programming language code.
- With flexible classification options, you can quickly select and manage your software.
Some Uses of SPSS Software
SPSS is used for data organization and collection.
The majority of researchers used to collect data using SPSS software. They also managed their data in SPSS by assigning properties to various variables. The data entry interface in SPSS for data analysis appears to be comparable to that of other spreadsheet apps. You can enter data and variables quantitatively and save the files as data files.
Data Output
When you collect and enter data into the datasheet in SPSS software, you may quickly create output files from the data. Because of this function, data output might be regarded as one of the best uses of SPSS. For example, one can create frequency distributions of big data sets to determine whether the data set is distributed regularly or not.
Statistical tests
The SPSS software is a necessary tool for researchers to use while doing statistical tests. This program eliminates the need for humans to create equations or do mathematical calculations. Instead, they can now use the built-in software, into which they must enter the data or numbers. This helps to obtain various types of analysis by pressing the appropriate keys. Using the SPSS software, one person runs the statistical tests on their PC. All of the outputs are automatically presented on the screen. They are saving individuals’ time and effort in manually calculating numerical data.
Some important benefits of SPSS Software.
Wide Range of options
It provides a large selection of charts and graphs and ways to choose them. SPSS also provides improved cleaning and screening tools for data that can be used in subsequent analyses.
Large storage capacity
The SPSS tool’s output is kept separate from the rest of the data. In other words, it retains the data output in different directories and files.
Effective data management
Because this tool’s program knows the specific positions of the variables and cases, it makes data analysis faster and easier.
What is Data analysis?
Data analysis is the well-organized application of statistical and logical approaches to explain, display, compress, summarize, and evaluate data. Researchers use data analysis to reduce data to a story and analyze it to get perceptions. Data analysis helps to reduce a large amount of data into smaller, more understandable fragments(parts), which makes it easier for students to understand. Three critical events occur during the data analysis process.
- The Data organization.
- Data reduction .
- Data analysis
Why do we need to analyze data in research?
As researchers have a story to tell or questions to answer, researchers finally depend on data. It all starts with a question, and data is simply the answer to that question. But what if there isn’t a question to be asked? Well! Even without a problem, it is possible to investigate data known as ‘Data Mining .’ It generally shows exciting patterns within the data worth studying.
Irrespective of the type of data researchers seek, their objective and the readers’ vision lead them to identify patterns that will shape the story they wish to convey. Researchers’ one of the most important things while studying data is being upfront and honest about unusual patterns, expressions, and results.

SPSS for data analysis.
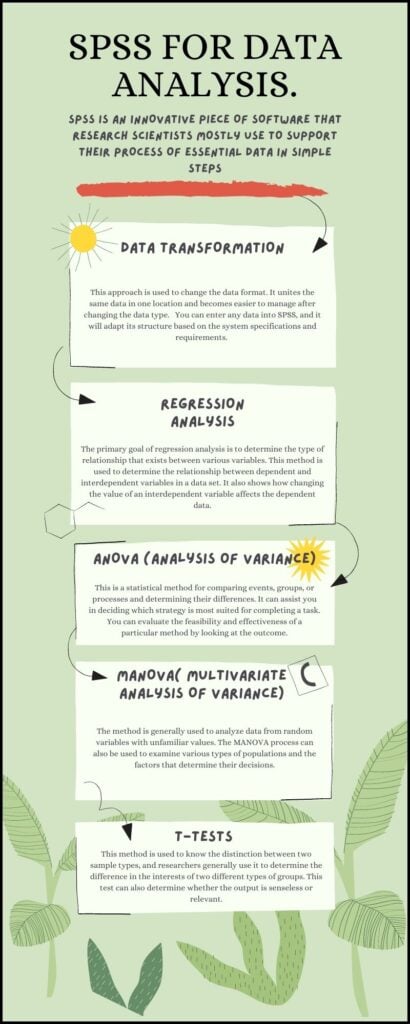
SPSS is an innovative piece of software that research scientists mostly use to support their process of essential data in simple steps. Working with data is a time-consuming and challenging process. However, with the help of specific strategies, this program can easily handle and operate on information. We use these strategies to examine, transform, and generate a distinct pattern. Furthermore, the output can be provided in a graphical depiction, allowing the user to understand the result quickly. Read on to learn about SPSS for data analysis and execution process.
Data Transformation
This approach changes the data format. It unites the same data in one location and becomes easier to manage after changing the data type. You can enter any data into SPSS, and it will adapt its structure based on the system specifications and requirements. This means that even if you change your operating system, SPSS will still operate with previous data.
Regression Analysis
The primary goal of regression analysis is to determine the type of relationship that exists between various variables. This method is used to determine the relationship between dependent and interdependent variables in a data set. It also shows how changing the value of an interdependent variable affects the dependent data.
ANOVA (Analysis of variance)
This is a statistical method for comparing events, groups, or processes and determining their differences. It can assist you in deciding which strategy is most suitable for completing a task. By looking at the outcome, you can evaluate the feasibility and effectiveness of a particular method.
MANOVA( Multivariate analysis of variance)
The method analyzes data from random variables with unfamiliar values. The MANOVA process can also help examine various types of populations and the factors that determine their decisions.
T-tests
Researchers use this method to distinguish between two sample types and generally to determine the differences in the interests of two different types of groups. This test can also determine whether the output is senseless or relevant.
Steps to determine data analysis using SPSS
Store your excel file with all the data
Once you have assembled all the data, keep the Excel file ready with all data, including using the appropriate tabular forms.
Import that excel file into SPSS Software
You can import your data into SPSS through your excel file. Once you import the data, the SPSS for data analysis will start analyzing it.
Provide precise SPSS instructions.
You can use desired commands in the SPSS software based on what you require to analyze. Each tool comes with instructions on how to use it, and you can enter all of the choices to get the most accurate results. Giving commands in SPSS is basic and easy to understand, making it a simple task for pupils to accomplish on their own.
The results
The software’s results are delivered quickly and precisely, giving researchers a more precise understanding of relevant planned studies.
Examine the graphs and charts
Understanding the results can be challenging. However, teachers can assist you with the analysis. You can also ask for the assistance of a professional company that specializes in data analysis using SPSS.
Suggest conclusions based on your SPSS for data analysis
The final goal of the SPSS analysis is to help in reaching conclusions based on the specific study. The software allows you to simply draw inferences and forecast the future with a low statistical variation.
Steps to download SPSS Software
- Search for SPSS statistics website to check the desktop platform minimum requirements.
- Click the Operating System tab.
- Go to the SPSS website and click on the Free SPSS test.
- You will get a trail version from here.
- Supported operating systems.
- Go to the IBM SPSS Statistics Box, then click on Start Trial.
Conclusions
In this blog, we have discussed SPSS analysis, data analysis using SPSS, and SPSS for data analysis. We hope you understand all the points mentioned above. If you need any assistance related to SPSS software, we are happy to assist 24/7. “If you are looking for the best SPSS assignment help service, feel free to contact our experts. They will provide you with the assistance you need.”
FAQ (Frequently Asked Question)
Is SPSS software available for free?
No, depending on the program’s intended use, it is available in various packages and with various licensing choices. For a set number of users, you can choose between a single-named user license and several concurrent user licenses.
On which operating systems SPSS Software is Compatible?
Obtaining the relevant installation file allows you to execute this statistical program on any machine that runs Windows, Linux, or Mac OS.


