

Do you know weather forecasters use different types of statistical analysis for predicting the weather? No, you might be not! Well, the computer use in weather forecasting is set on the statistics functions. All these functions compare the weather condition with the pre-recorded seasons’ conditions.
Different statistical concepts can easily applied to real life, like estimating the time to get ready for office, how much money is needed to visit work in a month or education, etc.
However, one should know the importance of statistics and learn how to analyze it. Here, In this blog, you will learn about statistical analysis and the different types of statistical analysis in detail.
Now, let’s discuss what Statistical Analysis is.
What is Statistical Analysis?
Table of Contents
Statistical analysis is a method of gathering data, exploring it, and then representing a vast volume of data in order to examine trends and patterns in the data. In everyone’s daily routine, statistics are used in industries, researches, and governments. It is also used to conduct scientific research and then determine the outcomes of that research. Take a look at some of its examples:
- Designers use statistics to create qualitative designs that improve the elegance of fabrics and take lifts to the airline industries. And it also helps the guitarists in producing beautiful notes of music.
- Many researchers use statistical analysis to keep children healthy by analyzing data from infectious disease vaccinations, ensuring the vaccines’ safety and consistency.
- Various communication firms use statistics to manage network resources better, improve services, and reduce customer churn by gathering more views according to the subscriber’s needs.
- Government agencies worldwide depend on statistical analysis to clean up data from their countries, individuals, and companies.
What Are The Types of Statistical Analysis
There are many different types of statistical analysis which are shown below:

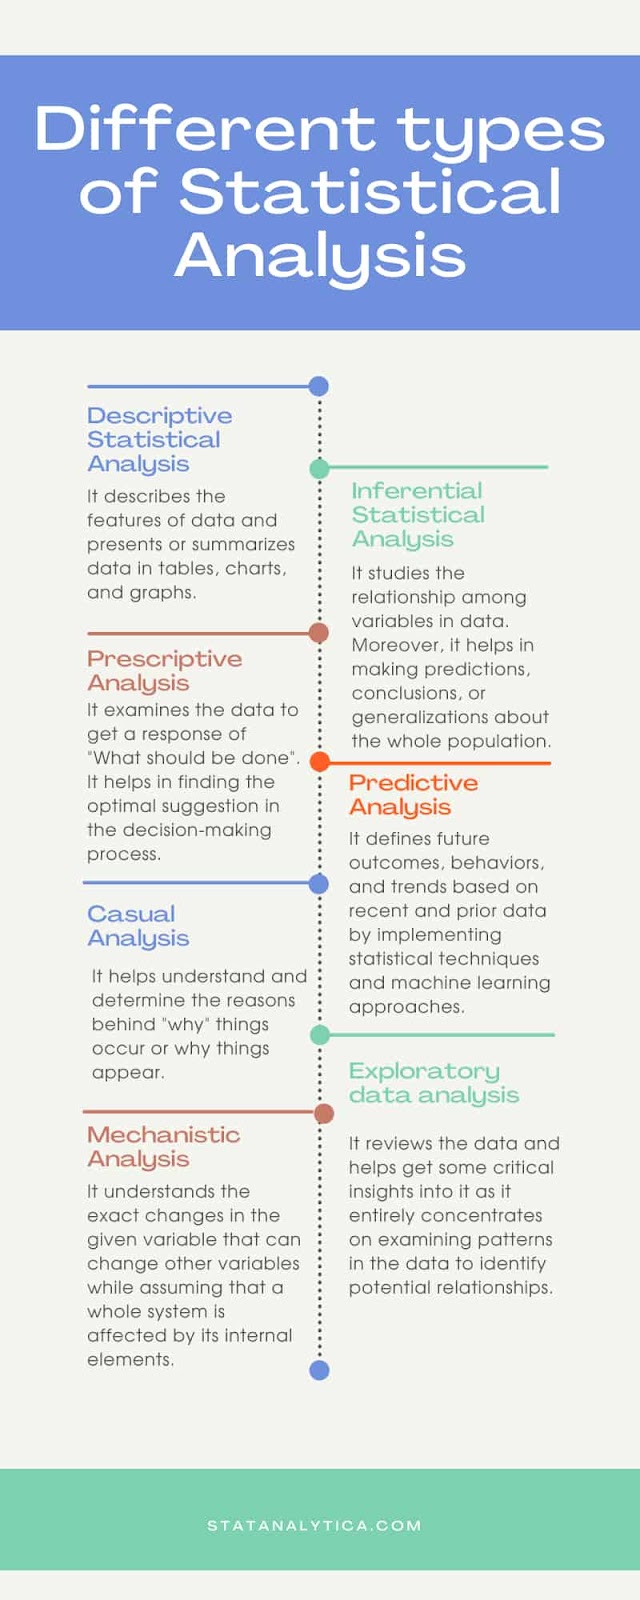
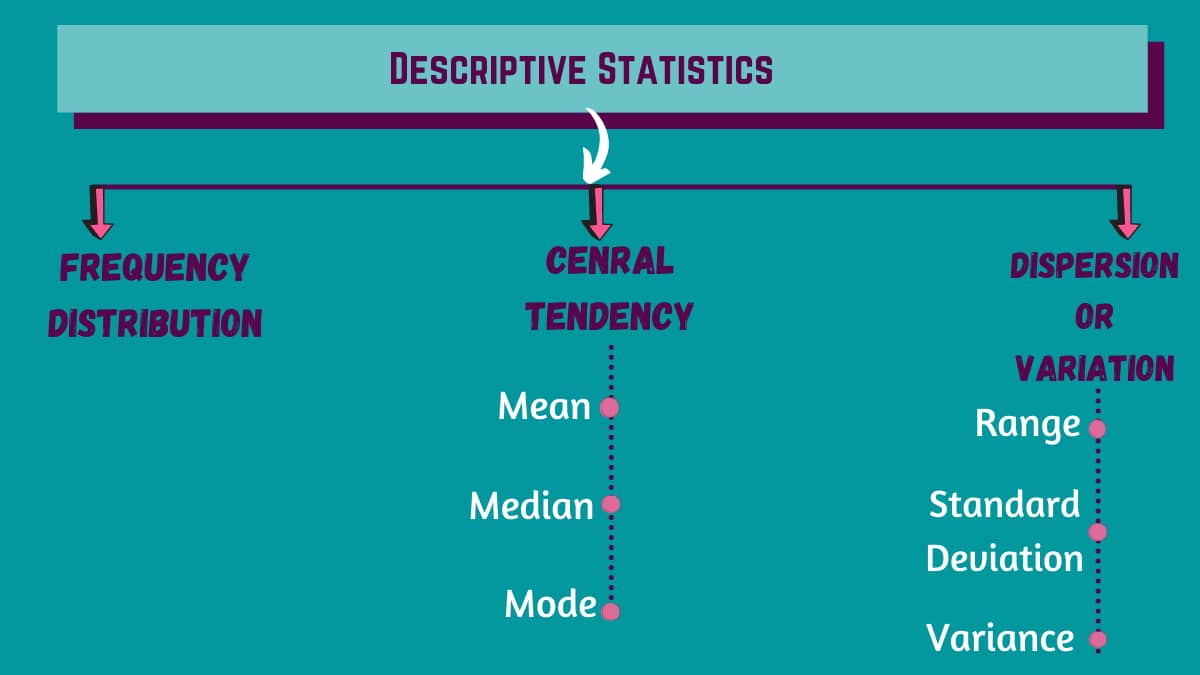
Descriptive Types of Statistical Analysis
As the name implies, descriptive statistical analysis helps to describe the data. It obtains a data summary so that information that is meaningful can be interpreted from it. We don’t come to a conclusion using descriptive analysis, but we do learn what’s in the data, i.e., the quantitative description of the data, which we know with the help of it.
For example, consider an example in which you would calculate how well the student performed during the semester by calculating the average. And this average is calculated by the sum of the score of all subjects in a semester by the total number of subjects. This number which you get describes the student’s overall performance.
We run the risk of distorting the original data or missing crucial information if we attempt to describe a large number of observations with a single value. The student’s average will not determine the student’s strong subject. It won’t tell you the student’s specialty or which subjects were simple or difficult for them. Despite these drawbacks, descriptive statistics may provide a powerful description that can be useful in comparing different units.
There are two types of statistics that are used to describe data:
- Measures of central tendency
- The measure of spread

Inferential Statistics
The population is the collection of data that includes the information we’re looking for. To generalize the population by using samples, inferential statistics are used. Where the sample is taken from the whole population. It is important that the surveys accurately reflect the population and are not biased. Sampling is the method of obtaining these types of samples. The term “inferential statistics” refers to the fact that sampling is bound to have errors and cannot be assumed to represent the population perfectly.
There are two types of Inferential Statistics methods used for generalizing the data:
- Estimating Parameters
- Testing of Statistical Hypothesis
Prescriptive Analysis
“What should be done?” By asking this question, prescriptive analysis works on the data. Identifying the best possible action for a situation is a common field of business analysis. Its whole purpose is to provide guidance with the aim of determining the best recommendation for a decision-making process. It is related to predictive and descriptive analysis. The descriptive analysis describes the data, or what has occurred, while predictive analytics forecasts what will occur. Prescriptive analysis selects the best option from a list of options.
Simulation, business law, complex event modelling, graph analysis, algorithms, and machine learning are some of the techniques used in prescriptive analysis.
Predictive Analysis
“What might happen?” Predictive analysis is a technique for prediction of future events. It is based on current as well as historical evidence. It employs statistical algorithms and machine learning techniques to predict future outcomes, patterns, and actions based on historical and new data. Predictive analytics is being used in business to gain a competitive edge and reduce the risk of an uncertain future. Marketing, financial services, internet service providers, and insurance firms are the most common users of predictive analysis. Simulation, data mining, artificial intelligence, and other techniques are used in predictive analysis.
Causal Analysis
Everyone wants to know the cause behind the “ WHY” question. Why the particular things are happening in a particular way. So casual analysis helps in knowing the WHY things. The business world is full of uncertainties. It includes both winning and failure. The causal analysis finds the reason behind why things are happening. The IT industry uses this technique commonly. It helps them to know about the quality assurance of the software.
Exploratory data analysis
It is a form of inferential statistics that data scientists essentially use. It is a method of analysis that focuses on finding trends in data and determining unknown relationships. Exploratory data analysis identifies missing data, discovers unknown relations, and develops hypotheses and assumptions. It shouldn’t be used on its own because it just gives you a bird’s-eye view of the data and some insight into it. It is the first step in data analysis and should be completed before all other formal statistical techniques.
Mechanistic analysis
In large industries, mechanistic analysis is important, although it is not a typical statistical analysis process. It is worth discussing. It’s used to figure out how specific changes in one variable affect the other variables. It is based on the premise that the interaction of a system’s internal components affects the system. It gives no allowance for external influences. It’s useful in a system of well-defined terms, such as biological science.
Also Read
- Why Study Statistics | What Are The Top Most Reasons to Study Statistics?
- Top Most Important Application of Statistics in Daily Life
- The Definitive Guide on Margin of Error in Statistics
What are the four common methods of Statistical Analysis?
Following are the most common methods for performing statistical analysis with examples:
Mean
You can measure the mean (or average) by adding the numbers in the lists and dividing the solution by the number of items. It is the simplest form of Statistical analysis. It allows the user to determine the middle point of a data set. The formula for calculating mean is;
Mean = Set of Numbers/ Numbers of items in the set
For example, you have a set of numbers (1,2,3,4,5 or 6). First of all, you will add these numbers together. The answer you will get is 21. Then you will divide 21 with the numbers of figures in the list, i.e., 6. Your final or correct answer is 3.5.
Standard Deviation
Standard deviation is used to determine the distribution of data points. It is a statistical analysis method that helps in determining how the data spreads around the mean. A high standard deviation refers to the data dispersed widely from the mean. A low standard deviation means that most of the data are closer to the mean. For calculating the standard deviation, the following formula is used;
σ2 = Σ(x − μ)2/n
- σ denotes standard deviation
- Σ describes the total of the data
- x denotes the value of the dataset
- μ serves the mean of the data
- n shows the number of data points in the population
For example, take the values of 2, 1, 3, 2, or 4.
First, determine the mean (average).
2+1+3+2+4= 12
Then divide 12 by 5. You will get 2.4 mean.
Second, subtract the mean from each value.
2 – 2.4= -0.4
1 – 2.4= -1.4
3 – 2.4= 0.6
2 – 2.4= -0.4
4 – 2.4= 1.6
Third, square all these differences.
-0.4 X -0.4= 0.16
-1.4 X -1.4= 1.96
0.6 X 0.6= 0.36
-0.4 X -0.4= 0.16
1.6 X 1.6= 2.56
Fourth, calculate the average of those squared numbers to get the variance.
0.16+1.96+0.36+0.16+2.56= 5.2
Then divide 5.2 by 5. You will get a 1.04 Variance.
Fifth, find the root square of the variance.
The square root of 1.04= 1.01
Thus, the standard deviation of the values 2, 1, 3, 2, or 4 is 1.01.
Regression
It is a statistical technique use to find the relation among dependent variables and independent variables. Regression helps to track how changes in one variable affect another variable. It is able to show the relationships among both variables are weak, strong, or vary over a time interval. The formula to calculate Regression is;
Y=a + b(x)
“Y” denotes the independent variable or the data used to predict the dependent variable.
“a” represents the y-intercepts and value of y when x’s value is zero.
“b” determines the slope of the regression graph.
“x” represents the dependent variable that you need to measure.
For example,
Find the dollar cost of repairing a car driven for 40,000 miles. If the maintenance cost when there is no mileage on the vehicle is $100. Take b as 0.02, so the cost of maintenance increases by $0.02 for every unit increase in miles driven.
- Y = cost of maintaining the car
- X = 40,000 miles
- a = $100
- b = $0.02
Y = $100 + 0.02(40,000)
Y = $900
This shows that mileage affects the repairing prices of a car.
Hypothesis Testing
It tests the conclusion is valid for a specific data set by comparing the data against the particular assumption. The test result can nullify the hypothesis, where it is called the null hypothesis or hypothesis 0. Anything that disrupts the null hypothesis is called the first hypothesis or hypothesis 1.
For example, if you want to test the hypothesis from the regression calculation, you require mileage affects a vehicle’s maintenance costs. Here, we deny the null hypothesis since the Regression above shows that mileage influences car maintenance costs.
Conclusion
Thus, here in this blog, we learned about different types of Statistical analysis and their various common methods. As we already know that Stat is not easy but a complicated subject. The number of learners finds it difficult. However, if you are facing any problem while doing your statistical assignment. Then don’t worry; we are here to provide you with statistics assignment help. If you think that who can do my statistics homework, feel free to contact us.
Frequently Asked Questions
What do you mean by Analytical Analysis?
Analytical skills refer to the ability to gather and examine information, problem-solve, and make judgments. You use analytical abilities when identifying patterns, brainstorming, analyzing, evaluating data, and making decisions rely on the various factors and options available to you.
What are Statistical tools?
The most popular Statistical tools are the mean, the arithmetical average of numbers, median and mode, Range, dispersion, standard deviation, interquartile range, coefficient of variation, etc. Additionally, software packages like SAS and SPSS help interpret the results for a large sample size.

