


Most of the students are not aware of the types of error in statistics. This guide will help you to know everything about the types of error in statistics. Let’s explore the guide:-
As ‘statistics’ relates to the mathematical term, individuals start analyzing it as a problematic terminology, but it is the most exciting and straightforward form of mathematics. If you are looking for mathematics experts who can complete your math homework, then don’t worry. We are here to help you, our expert can provide you with the best maths homework help.
As the word ‘statistics’ refers that it consists of quantified statistic figures. That we use to represent and summarize the given data of an experiment or the real-time studies. In this article, we will discuss the following topics in detail:-
- What is the error in statistics?
- What is the standard error in statistics?
- How many types of errors in statistics?
- What are the sampling error and non-sampling error in statistics?
- What is the margin of error in statistics formula?
Before discussing these topics as mentioned above in this article, we want to say that if you are looking for a statistics homework helper, then don’t worry you can get the best statistics homework help from our experts. So, what are you waiting for get help now!

What Is The Error In Statistics?
Table of Contents
Statistics is a methodology of gathering, analyzing, reviewing, and drawing the particular information’s conclusion. The statistical error is the difference between the collected data’s obtained value and the actual value of the collected data. The higher the error value, the lesser will be the representative data of the community.
In simple words, a statistics error is a difference between a measured value and the actual value of the collected data. If the error value is more significant, then the data will be considered as the less reliable. Therefore, one has to keep in mind that the data must have minimal error value. So that the data can be considered to be more reliable.
Types Of Error In Statistics

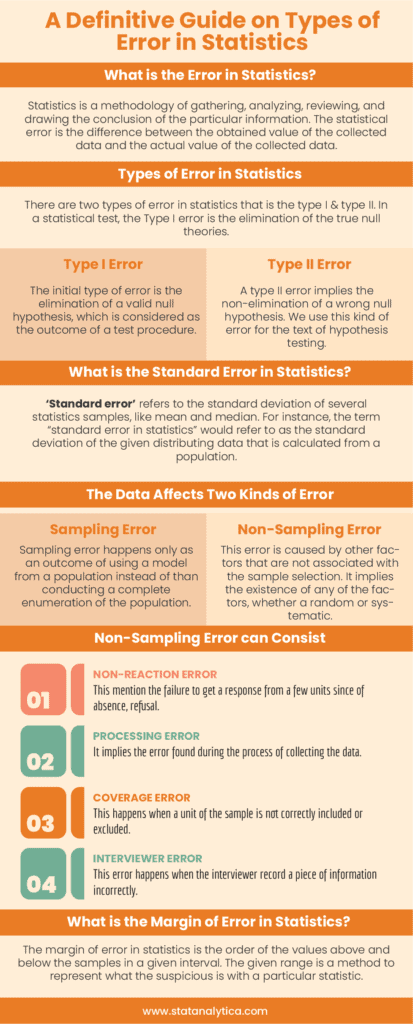
There are main two types of error in statistics that is the type I & type II. In a statistical test, the Type I error is the elimination of the true null theories. In contrast, the type II error is the non-elimination of the false null hypothesis.
Plenty of the statistical method rotates around the reduction of one or both kind of errors, although the complete rejection of either of them is impossible.
But by choosing the low threshold value and changing the alpha level, the features of the hypothesis test could be maximized. The information on type I error & type II error is used for bio-metrics, medical science, and computer science. On the other hand, we also mentioned type III error in this post.
Type I Error
The initial type of error is eliminating a valid null hypothesis, which is considered the outcome of a test procedure. This type of error is sometimes also called an error of the initial type/kind.
A null hypothesis is set before the beginning of an analysis. But for some situations, the null hypothesis is considered as not being present in the ‘cause and effect’ relationship of the items that are being tested.
This situation is donated as ‘n=0’ if you are conducting the test, and the outcome seems to signify that applied stimuli may cause a response, then the null hypothesis will be rejected.
Examples Of Type I Error
Let’s take an example of the trail of a condemned criminal. The null hypothesis can be considered as an innocent person, while others treat it as guilty. In this case, Type I error means that the individual is not found to be innocent. And individual needs to be sent to jail, despite being an innocent.
In another example, in medicinal tests, a Type I would bring its display as a cure of disease tends to minimize the seriousness of a disease, but actually, it is not doing the same.
Whenever a new dose of disease is tested, then the null hypothesis would consider as the dose will not disturb the progress of the particular ailment. Let’s take an example of it as a lab research a new cancer dose. The null hypothesis would be that the dose will not disturb the progress of the cancer cells.
After treating the cancer cells with medicine, the cancer cells will not progress. This may result to eliminate the null hypothesis of that drug that does not have any effect. The medicine is successful in stopping the growth of cancer cells, then the conclusion of rejecting the null value will be correct.
However, while testing the medicine, something else would help to stop the growth rather than the medicine, then this could be treated as an example of an incorrect elimination of the null hypothesis that is a type I error.
Type II Error
A type II error implies the non-elimination of a wrong null hypothesis. We use this kind of error for the text of hypothesis testing. In the statistical data analysis, type I errors are the elimination of the true null hypothesis.
On the other hand, type II error is a kind of error that happens when someone is not able to eliminate a null hypothesis, which is wrong. In simple words, type II error generates a false positive. The error eliminates the other hypothesis, even though that does not happen due to chance.
A type II error proves an idea that has been eliminated, demanding the two observances could be identical, even though both of them are dissimilar. Besides, a type II errors do not eliminate the null hypothesis. Even though the other hypothesis has the true nature, or we can say that a false value is treated as true. A type II error is well-known as a ‘beta error’.
Type II Error’s example
Suppose a biometric company likes to compare the effectivity of the two medicines that are used for treating diabetic patients. The null hypothesis refers to the two treatments that are of similar effectivity.
A null hypothesis (H0) is the demand of the organization that concern to eliminate one-tailed test uses. The other hypothesis refers to the two medications are not identically effective. The other hypothesis (Ha) is the calculation, which is backed by eliminating the null hypothesis.
The biotechnical organization decided to conduct a test on 4,000 diabetic patients to evaluate the treating effectivity. The organization anticipates the two medicines should have a similar number of diabetic patients to ensure the effectivity of the drugs. It chooses a significant value of 0.05 that signifies that it is ready to adopt a 6% chance of eliminating the null hypothesis when it is considered to be real or a chance of 6% of carrying out a type I error.
Suppose beta would be measured as 0.035 or as 3.5%. So, the chances of carrying out a type II error is 3.5%. When the two cures are not identical, then the null hypothesis must be eliminated. Still, the biotechnical organization does not eliminate the null hypothesis if the medicine is not identically effective, then the type II error happens.
Type III Error
Type III errors, also known as conceptual errors, occur when researchers test the wrong hypothesis or design an experiment that does not accurately address the research question.
In simpler words, a type III error arises when a researcher investigates a relationship between two variables that are not related and concludes that they are related based on the results of the analysis. As a result, this error can result in misguided policies and inaccurate conclusions.
Example of Type III Error
For example, let’s say a researcher is interested in examining the relationship between ice cream consumption and crime rates. After collecting and analyzing data, the researcher finds a significant correlation between the two variables. However, this relationship is a type 3 error because ice cream consumption does not cause crime.
In this case, the researcher has failed to consider other important variables, such as temperature or time of day, that may influence ice cream consumption and crime rates. Therefore, the researcher’s conclusion that ice cream consumption is related to crime rates is incorrect, and any policies or interventions based on this conclusion would be misguided.
Test Your Knowledge About Types Of Error In Statistics
- A Type I error occurs if
- A null hypothesis needs to be not rejected but must be rejected.
- The given null hypothesis is rejected, but actually, it needs not be rejected.
- A test statistic is wrong.
- None of these.
| Correct Answer: The given null hypothesis is rejected, but actually, it needs not be rejected. |
2. A Type II error occurs if
- A null hypothesis needs to be not rejected but must be rejected.
- The given null hypothesis is rejected, but actually, it needs not be rejected.
- A test statistic is wrong.
- None of these.
| Correct Answer: A null hypothesis needs to be not rejected but must be rejected. |
3. Deciding on the significance level ‘α’ helps in determining
- the Type II error’s probability.
- the Type I error’s probability.
- the power.
- None of these.
| Correct Answer: the Type I error’s probability. |
4. Suppose a water bottle has a label stating – the volume is 12 oz. A user group found that the bottle is under‐filled and decided to perform a test. In this case, a Type I error would mean
- The user group does not summarize that the bottle has less than 12 oz. The mean is also less than 12 oz.
- The user group has proof that the label is wrong.
- The user group summarizes that the bottle has less than 12 oz. The mean is also 12 oz.
- None of these.
| Correct Answer: The user group summarizes that the bottle has less than 12 oz. The mean is also 12 oz. |
5. A Type I error happens in the case the null hypothesis is
- correct.
- incorrect.
- either correct or incorrect.
- None of these.
| Correct Answer: correct. |
6. A Type II error happens in the case the null hypothesis is
- correct.
- incorrect.
- either correct or incorrect.
- None of these.
| Correct Answer: incorrect. |
7. Suppose the significance level ‘α’ is raised; in this case, the uncertainty of a Type I error will also
- decrease.
- remain the same.
- increase.
- None of these.
| Correct Answer: increase. |
8. Suppose the significance level ‘α’ is raised; in this case, the uncertainty of a Type II error will also
- decrease.
- remain the same.
- increase.
- None of these.
| Correct Answer: decrease. |
9. Suppose the significance level ‘α’ is raised; in this case, the power will also
- decrease.
- remain the same.
- increase.
- None of these.
| Correct Answer: increase. |
10. The test’s power can increase by
- selecting a smaller value for α.
- using a normal approximation.
- using a larger sample size.
- None of these.
| Correct Answer: using a larger sample size. |
What Is The Standard Error In Statistics?
‘Standard error’ refers to the standard deviation of several statistics samples, like mean and median. For instance, the term “standard error in statistics” would refer to as the standard deviation of the given distributing data that is calculated from a population. The smaller the value of the standard error, the larger representative the overall data.
The relation between standard deviation and the standard error is that for a provided data, the standard error is equal to the standard deviation (SD) upon the square root of the offered data size.
Standard error = standard deviation
√ Given data
The standard error is inversely proportional to the given model size, which means the higher the model size, the lesser the value of standard error since the statistic will tend to the actual value.
Standard error ∝ 1/sample size
The standard error is taken as a portion of explanatory statistics. The standard error shows the standard deviation (SD) of an average value into a data set. It treats as a calculation of the random variables as well as to the extent. The smaller the extent, the higher the accuracy of the dataset.
The Data Affects Two Kinds Of Error
Here in this section, you get to know how the data affects two kinds of error:
1. Sampling error
Sampling error happens only as an outcome of using a model from a population instead of than conducting a complete enumeration of the population. It implies a difference between a prediction of the value of community and the ‘true or real’ value of that sample population that would result if a census would be taken. The sampling error does not happen in a census as it is based on the whole community.
Sampling error would cause when:
- The method of sampling is not accidental.
- The samples are smaller to show the population accurately.
- The proportions of several features within the sample would not be identical to the proportion of the features for the entire population.
Sampling error can be calculated and handled in random samples. Especially where every unit has a hope of selection, and the hope can be measured. In other words, the increment in the sample size would decrements in the sampling error.
2. Non-sampling error
This error is caused by other factors that are not associated with the sample selection. It implies the existence of any of the factors, whether a random or systematic, that output as the true value of the population. The non-sampling error can happen at any step of a census or study sample. And it is not easily quantified or identified.
Non-sampling error can consist
- Non-reaction error: This mention the failure to get a response from a few units since of absence, refusal, non-contact, or some other reason. The non-reaction error can be a partial reaction (that is, a chosen unit has not supported the solution to a few problems) or a complete reaction (that is no information has been taken at all from a chosen unit).
- Processing error: It implies the error found during the process of collecting the data, coding, data entry, editing, and outputting.
- Coverage error: This happens when a unit of the sample is not correctly included or excluded or is replicated in the sample (for example, an interviewer is not able to interview a chosen household).
- Interviewer error: This error happens when the interviewer record a piece of information incorrectly, is not objective or neutral or assumes reaction based on looks or other features.
What Is The Margin Of Error In Statistics?
The margin of error in statistics is the order of the values above and below the samples in a given interval. The given range is a method to represent what the suspicious is with a particular statistic.
For example, a survey may be referred that there is a 97% confidence interval of 3.88 and 4.89. This means that when a survey would be conducted again with the same technical method, 97% of the time, the real population statistic will lay within the estimated interval (i.e., 3.88 and 4.89) 97% of the time.
The Formula For Calculating The Margin Of Error Percentage
A marginal error implies to you how many different values would be resulted from the true population value. For instance, a 94% confidence interval by a 3% margin of error means that your calculated statistics would be within 3% points to the true population value 945 of the time.
The Margin Of Error Can Be Measured In Two Ways:
- The margin of error = Standard deviation of the statistics x Critical range value
- The margin of error = Standard error of the statistic x Critical value
Steps on Calculate Margin of Error
Step 1: Calculate the critical value. The critical value is either of a z-score or t-score. In general, for the smaller value (under 30) or when you do not have the standard deviation of the population. Then use a t-score, in another way, use a z-score.
Step 2: Calculate the standard error or standard deviation. These two are an identical thing, and merely you should have the population parameter value to measure standard deviation.
Step 3: Multiply the standard deviation and the critical value.
Sample problem: 100 students were polled and had a GPA of 2.5 with a standard deviation of 0.5. Calculate the margin of error in statistics for a 90% confidence range.
- The value of critical for a 90% confidence range is 1.645 (see the table of z-score).
- The SD is 0.5 (as it is a sample, we require the standard error for the mean.) the SE can be calculated as the standard deviation / √ Given data; therefore, 0.5/ √ (100) = 0.05.
- 1.645*0.05 = 0.08125.
The margin of error for a proportion formula:


where :
p-hat = sample proportion; n= sample size; z= z-score
Steps to calculate margin error for a proportion
Step 1: Calculate p-hat. This can be calculated by the number of the population who have been responded positively. It means that they have given the answer related to the given statement of the question.
Step 2: Calculate the z-score with follows the confidence level value.
Step3: Put all the value in the given formula:

Step 4: Convert step 3 into the percentage.
Sample problem
1000 individuals were polled, and 380 think that climate alters not because of human pollution. Calculate the ME for a given 90% confidence value.
- The number of individuals who respond positively; 38%.
- A 90% confidence level has a critical value (z-score) of 1.645.
- Calculate the value by using the formula
=1.645*[ √ {(38*.62)/(1000)}]
=0.0252
4. Convert the value into a percentage.
0.0252= 2.52%
The margin of error in statistics is 2.52%.
Conclusion
This is all about types of error in statistics. Use the details as mentioned earlier, you can understand types of error in statistics. But, still, you find any issue related to the topic error in statistics. Then you can get in touch 24*7 with our professional experts. They have enough knowledge of this particular topic; therefore, they can resolve all the queries of yours.
Get the best statistics homework help from the professional experts at a reasonable price. We provide you the assignment before the deadline so that you can check your work. And we also provide a plagiarism-free report which defines the uniqueness of the content. We are providing world-class help on math assignment help to the students who are living across the globe. We are the most reliable math assignment helpers in the world.
Frequently Asked Question
Q1. What is the difference between Type 1 and Type 2 errors?
In statistical hypothesis testing, Type 1 error is caused by rejecting any of the null hypotheses (in case it has true value). Type II error occurs while a null hypothesis is taken (if it does not have a true value).
Q2. What is random error example?
A random error can happen because of the measuring instrument and can be affected by variations in the experimental environment. For example, a spring balance can produce some variation in calculations because of the unloading and loading conditions, fluctuations in temperature, etc.
Q3. What type of error is human error?
Random errors are considered to be natural errors. Systematic errors occur because of problems or imprecision with instruments. Now, human error is something that humans screwed up; they have made a mistake. These cause human errors.
Q4. What are Type 3 errors in statistics?
A type III error occurs in statistics when you correctly conclude that the two groups are statistically different but incorrect about the difference’s direction.


