Statistics

Get all the Latest Updates on Statistics.

characteristics of binomial distribution

Key Characteristics of Binomial Distribution: A Comprehensive Guide

Probability distributions are important in statistics because they explain the likelihood of different outcomes in a series of experiments or events. The binomial distribution is a popular probability distribution that plays an important role in statistical analysis and decision-making. Its simplicity and effectiveness make it a useful tool in a variety of fields. From quality […]

Key Characteristics of Binomial Distribution: A Comprehensive Guide Read More »

Statistical Experiment Ideas

20 Simple and Effective Statistical Experiment Ideas for Beginners

Are you looking for interesting and simple ways to investigate statistics through experiments? Whether you’re a student, a teacher, or just want to learn more about data analysis, running statistical experiments is a great approach to improve your skills. These concepts, which range from investigating human behavior to verifying scientific assumptions, will pique your interest.

20 Simple and Effective Statistical Experiment Ideas for Beginners Read More »

Characteristics of Statistics

Understanding the Key Characteristics of Statistics

Statistics is more than just numbers on a spreadsheet—it’s a powerful tool for understanding and interpreting the world around us. Whether you’re interested in sports, business, healthcare, or social sciences, statistics plays a crucial role in making sense of data. In this blog, we will dive deep into the key characteristics of statistics, making it

Understanding the Key Characteristics of Statistics Read More »

Causation vs Correlation

Causation vs Correlation: Understanding the Differences

When studying data, you might come across terms like causation and correlation. Though these terms may seem similar, they describe very different relationships between variables. Understanding the distinction between causation and correlation is essential for interpreting data correctly and making informed decisions. In this blog post, we will explore these concepts in detail, using simple

Causation vs Correlation: Understanding the Differences Read More »

Statistics Tools

Top 10 Statistics Tools to Get Better Data Insights In 2024

You might have heard about NEWS channels that predict which government is going to win the election. How is it possible to know which will be the winning party? Well, it is just because of the statistical information carried out using different statistical tools.  Statistics are helpful for predicting the future outcome in different aspects

Top 10 Statistics Tools to Get Better Data Insights In 2024 Read More »

Sustainable Coding

The Ultimate Guide to Sustainable Coding Practices

In today’s fast-paced digital age, where technology is growing exponentially, there is an ever-increasing demand for energy resources. Technology’s environmental footprint, however, is an often overlooked concern. Software developers are in a unique position to address this issue by adopting sustainable coding practices, which not only optimize code for performance but also reduce its environmental

The Ultimate Guide to Sustainable Coding Practices Read More »

Data Visualization In Statistical Analysis

Importance Of Data Visualization In Statistical Analysis

These days, we’re surrounded by so much data that it can be hard to make sense of it all. Imagine trying to understand a huge list of numbers and complex tables—it’s easy to get confused. That’s where data visualization comes in. By turning data into easy-to-read charts, graphs, and dashboards, it helps us spot important

Importance Of Data Visualization In Statistical Analysis Read More »

Normal Distribution In Statistics

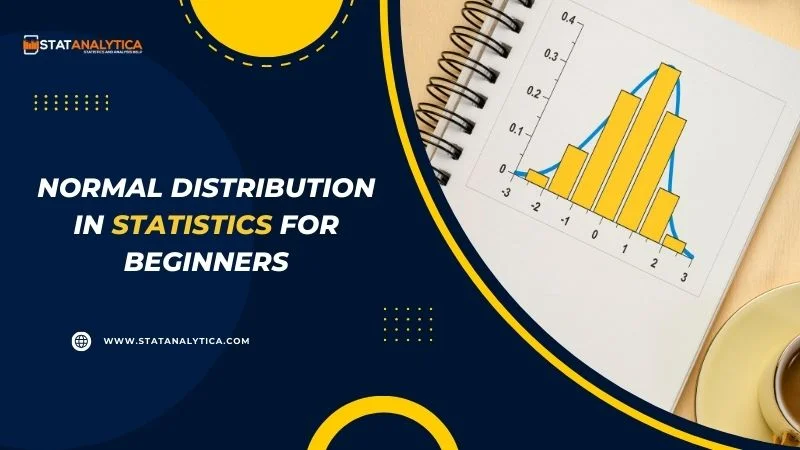
Understanding Normal Distribution In Statistics For Beginners

Understanding normal distribution is a great place to start when you’re starting with statistics. Think of a pattern that shows up in everyday situations, like people’s heights or test scores, creating a bell-shaped curve. This is what normal distribution looks like—it helps us see how most values in a group are close to the average.

Understanding Normal Distribution In Statistics For Beginners Read More »