Being a statistics student, you should know what bias in statistics is. The majority of the students are still confused about the bias in statistics. In this blog, we are going to share with you what is bias and what are its types.
Let’s get started with a short introduction to bias. Bias is all about the measurement of the process. This process helps us to get over or underestimate the value of the parameter.
What is Bias in Statistics?
Table of Contents
The definition of Bias in Statistics is as follows. Bias in statistics is a term that is used to refer to any type of error that we may find when we use statistical analyses. We can say that it is an estimator of a parameter that may not be confusing with its degree of precision. It is the tendency of statistics, that is used to overestimate or underestimate the parameter in statistics. There are several reasons to raise bias in statistics. One of the primary reasons for this is the failure to respect either comparability or consistency.
Let A be a statistic used to estimate a parameter θ. If E(A)=θ +bias(θ)} then bias(θ)} is called the bias of the statistic A, where E(A) represents the expected value of the statistics A. If bias(θ)=0}, then E(A)=θ. So, A is an unbiased estimator of the true parameter, say θ.
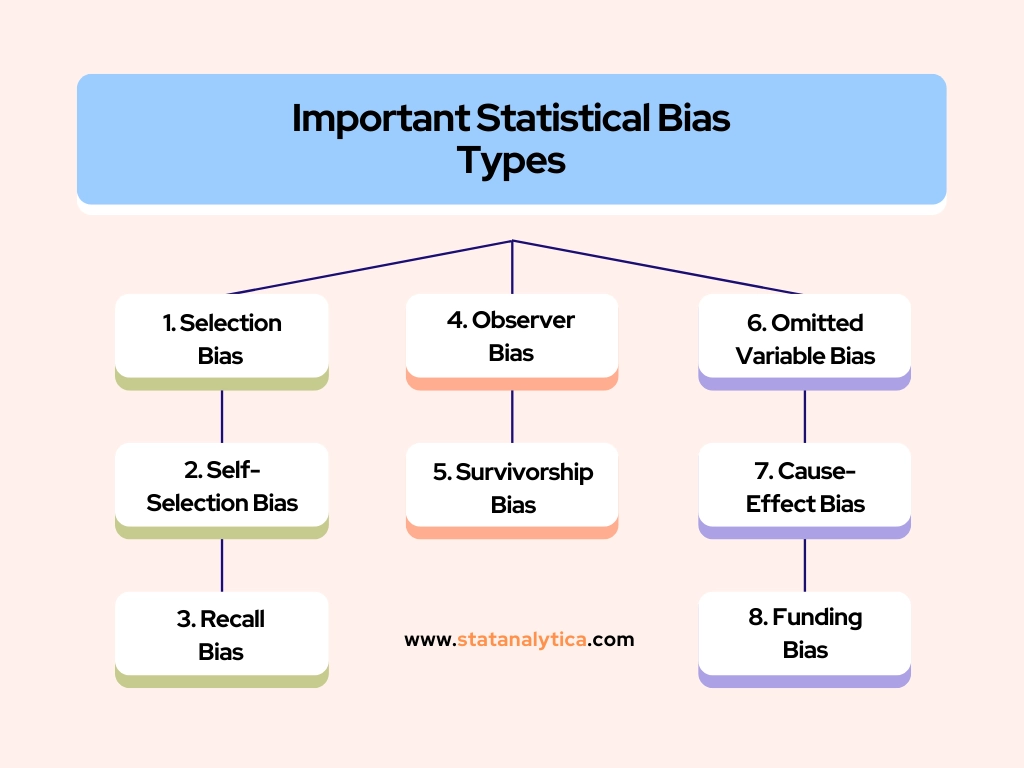
The Most Important Statistical Bias Types
Here are the most important types of bias in statistics. There are a lot of biases in statistics. It is quite tough to cover all the types of bias in a single blog post.
Therefore I am going to share with you the top 8 types of bias in statistics. These biases usually affect most of your job as a data analyst and data scientist. If you want to be one of them, then stay tuned with us. Let’s explore the top 8 types of bias in statistics.
1. Selection Bias
When you are selecting the wrong set of data, then selection bias occurs. It can be done as you are trying to get the sample from the subset of your audience apart from the entire set of the audience.
In this way, the calculation you may perform will not indicate or represent the whole population data. There are plenty of other reasons behind the selection bias, but the primary reason for this is, collecting the data from an easy-to-access source. Thus every time the data may obtain from the wrong source.
For example, suppose you are doing a survey about what is the person’s opinion regarding the presidency of Donald Trump. You have collected the data in which various individuals have well-detailed and immediate answers to this question. But, unfortunately, various of them have a top source for their answer Facebook Feed. It is not considered reliable as it is not public opinion but their friends’ opinion. Therefore, this kind of data can be categorized as classic selection bias that is accessible easily but only for unrepresentative and specific subsets of the overall population.
2. Self-Selection Bias
Selection bias also has a subcategory, i.e., the self-selection bias. It is just like the selection. In this, you may let the analysed subject select themselves. Suppose that in a group of people, you allow people to choose themselves based on some criteria. In the self-selection bias, there is a possibility that lazy people may not choose themselves or considered themselves as part of the group. Because it is based on a specific behaviour.
Let’s take another example of it, Suppose you are doing a survey to check the behaviour of successful entrepreneurs. In this case, the answer can be uncertain as successful persons do not have enough time to answer any random survey questions. Therefore, 98% of answers will be given by entrepreneurs who believe that they are successful entrepreneurs, but actually, they are not. In this case, the surveyor (self-selector) must take a face-to-face interview with the successful persons to get accurate survey data.
3. Recall Bias
This type of bias in statistics usually occurs in interview or survey situations, as the name suggests that it is based on the respondent’s memory power. During the interview time, when the responder doesn’t remember everything correctly, then this situation emerges the recall bias.
It is the typical scenario that we remember something, and we forget something in quick sessions. Besides, it is tough for us to remember all the things we have seen, read, listen to, or watched. It is usual for us, but when we do the survey, then it makes the survey an overwhelming process.
For example, suppose you went on holiday 3 years ago. There is the possibility that you have forgotten the bad things, but you just remember (recall) the good things. Eventually, it does not support us to evaluate the memories, but our brains have the tendency to keep the good memories for specific reasons.
4. Observer Bias
Observer bias is a pretty common bias. Because most of the time, the researchers subconsciously project or evidence his/her expectation from the research that will be going to happen this research. I mean to say that the researcher also tells others about their projection in many forms. For instance, influencing other participants, and making some serious conversation.
All these lead to observer bias. For example, it has been seen that observer bias affects analytical research in the case of Usability tests. Being a user researcher, you can easily know about your product to which you have some expectations.
If you have some experience, you might know that you should not influence your tester with questions. In case you do not have any experience in this field, remember you must have enough time to prepare unbiased and good questionnaires. You can also take the professionals’ help or idea for it.
Read More:
5. Survivorship Bias
When we need to perform the statistical operation on the pre-selection process. In this type of bias, the researcher’s evidence focuses only on the specific part of the data or study rather than the entire set of data or study. It was also missing those data points that are not visible anymore and also fell off during this process.
For example, there is a most interesting story collection about the statistical biases about falling cats. A study in 1987 stated that cats who fell from a higher building have some injuries compared to cats who fell from a lower building. The phenomenon used behind it was terminal velocity. This signifies that the cat which falls from the high building reached the maximum velocity that gave enough time to prepare for the landing.
But after 10 years, a newspaper pointed to the fact that the cat’s chances of dying are much higher compared to the cats who fall from the lower building. The cats that fell from a higher building survived luckily. Here the survivorship bias has been included in the previous case.
6. Omitted Variable Bias
Sometimes we miss the most crucial element from the model of our research. In this case, the omitted variable bias occurs. This biased approach to predictive analytics.
For example, in online businesses, business managers check the behavior of the user to make decisions for upcoming product projects. Suppose you are the manager of the company and you are observing the user activity. You make a model that estimates the user will not cancel the subscription (the estimation is 75% accurate).
But the next week, you found that there is a huge jump in the cancellation of the subscription. What is this? It means that strong competitors entered the market with similar services. This is what you are not prepared for. In this case, the competitor is the omitted variable for which it is impossible to prepare the predictive models.
7. Cause-Effect Bias
Cause-effect bias is one of the most critical biases for decision-makers. But most of the decision-makers are not aware of it. It is based on the simple formula that correlation does not imply causation.
For example, students who had professors in high schools scored bad grades compared to students who did not. This might look like a misguided picture or might not link to a real example. But here the point is that here the tutoring method was not the cause of scoring the bad grades, but the bad score was the cause of the effects. This specifies that there is a need for a good education method.
8. Funding Bias
The funding bias is also known as sponsorship bias. When the scientific suggestions or study results are biased in favor of financial sponsors of the research, then funding bias occurs.
For example, a researcher at Duke University did a study related to A Sugar Association funds and found that there are various adverse effects on health by consuming Splenda (Sucralose). Here is a point that the study’s sponsor was interested in alerting society about artificial sweeteners. But other organizations, such as the FDA, WHO, and others (who mostly sponsored their research), indicated that sucralose components are safe to use.
9. Measurement Bias
Measurement bias, also known as instrumental bias, refers to a type of statistical bias that arises when the measurement instrument used in a study is inaccurate or inconsistent. This can lead to biased estimates or results, as the measured values are systematically different from the true values. Measurement bias can occur in many ways, such as through faulty equipment, incorrect calibration, or inconsistent application of measurement procedures. For example, if a scale used to measure weight consistently gives readings that are 2 pounds too high, this would introduce measurement bias into any study that relies on weight measurements.
Measurement bias can have serious consequences for the validity and reliability of research findings. It can lead to incorrect conclusions, misinterpretation of results, and faulty generalizations. To minimize the impact of measurement bias, researchers should use valid and reliable measurement instruments, calibrate equipment regularly, and follow standardized measurement procedures. Additionally, data quality checks and validation procedures should be employed to identify and correct for any potential sources of measurement bias.
10. Publication Bias
Publication bias is a type of statistical bias that occurs when studies or research results that show significant or positive results are more likely to be published than those that do not. This can lead to an overrepresentation of positive or significant findings in the published literature, which can bias the overall conclusions of a research field or topic. Publication bias can occur for several reasons, such as editorial bias, the preferences of reviewers or publishers, or the lack of interest or funding for research that does not show significant or positive results.
Publication bias can have serious consequences for scientific research and can lead to misleading or inaccurate conclusions. To address this issue, researchers and publishers can take several steps, such as registering study protocols before data collection, publishing null or negative results, and encouraging replication studies to confirm or refute findings. Additionally, meta-analyses, which combine data from multiple studies, can help to identify and correct for publication bias by including unpublished or grey literature in their analyses.
A Quiz: How Do You Identify Bias In a Sample
Case 1:
Zen hosts a program, and he is very excited to know how his audience likes the show. Therefore, he decides to do an online survey in which he asks the listeners to go to the website and participate in the survey.
The survey shows that 89% of the audience loves the show.
1. What is the respecting source of bias in this particular survey?
(A) Response bias
(B) Voluntary response sampling
(C) Undercoverage
2. Which direction of bias is applied in this case?
(A) 89% is an overestimated percentage of all audiences who love the program.
(B) 89% is an underestimated percentage of all audiences who love the program.
(C) 89% is an unbiased estimation.
Case 2:
Zen hosts a program, and he is very excited to know how his audience likes the show. He decided that he will do some surveys of 100 audiences who send the fan email to him.
Not all of the audience persons responded, but 94 out of 97 audiences respond as they “love” the show.
1. What is the respecting source of bias in this particular survey?
(A) Nonresponse
(B) Voluntary response sampling
(C) Convenience sampling
2. Which direction of bias is applied in this case?
(A) The result is an underestimated percentage of all audiences who love the program.
(B) The result is an unbiased estimation.
(C) The result is an overestimated percentage of all audiences who love the program.
Case 3:
A high school decided to survey what percentage of the students smoke cigarettes. When students went to the counselor to know about scheduled classes, he/she asked each student whether they smoked cigarettes or not.
The survey’s result is that 5% of students smoke.
1. What is the respecting source of bias in this particular survey?
(A) Response bias
(B) Voluntary response
(C) Biased wording
2. Which direction of bias is applied in this case?
(A) The result is an unbiased estimation.
(B) The result is an underestimated percentage of all audiences who love the program.
(C) The result is an overestimated percentage of all audiences who love the program.
Correct Answers:
| CASE 1 |
| (B) | It is a voluntary response sample that mostly produces biased outputs. |
| (A) | People who enjoy the show visit the website and answer the survey questions without any discussion with others. |
| CASE 2 |
| (C) | Here, the result got from the particular audience, not from the randomly selected audiences. |
| (C) | Audiences who send a fan email to Zen show have loved the program in comparison to a typical audience. |
| CASE 3 |
| (A) | Response bias is caused if people are regularly dishonest about the answer to a question. |
| (B) | There is the possibility that students who answered that they smoke, but actually they don’t or vice-versa. Therefore, it is underestimated result. |
Conclusion
In this blog, you get to know about the definition of statistics in bias and some major types of statistics in bias. On the other hand, there are a lot more types of bias in statistics. But we have covered the most crucial one. I guess now it is clear in your mind what is statistics in bias. However, if not then let us know in the comment section that is given below, and we will get back to you as soon as possible.
If you need any help regarding the bias in statistics then you can get in touch with our experts. They will solve all your queries as soon as possible. Also, get the best statistics assignment help online from the experts at nominal charges.
FAQs
Q1. What is bias short answer?
Bias is a tendency or inclination towards a particular perspective, idea, or opinion, which may cause someone to act or think in a way that is unfair or not based on objective facts or evidence.
Q2. Is bias an error?
Yes, bias can be considered an error because it can lead to inaccurate or incomplete judgments or decisions based on incomplete or flawed information. As a result, you can be considered biased an error.
Q3. What are the 4 types of bias in statistics?
Here are the 4 most important types of bias in statistics which are as follows.
1. Selection bias
2. Self-Selection bias
3. Survivorship bias
4. Recall bias
Q4. What causes bias in statistics?
Most bias is caused by sampling bias. Suppose some differences are caused not only due to chances but also caused by sampling bias. Sampling bias occurs when certain variable values might systematically lack or over-represented or under-represented regarding the true variable distributions.

