The comparison between Excel vs Tableau or Tableau vs excel is an overwhelming process for statistics students. But it is not as overwhelming as it is supposed to be for the students.
Before moving to the difference between excel and Tableau, just think about a question: Did you know that? Both of these software offers the same functionalities to perform some tasks. But the enhancement in the functionalities is a lot different between Excel and Tableau.
Moreover, both have their own features that are unbeatable. Excel is useful and popular over Tableau as it has existed for a long time. That is why most of the users are familiar with its functionality.

But, Tableau is also not lacking behind as it is listed among the top BI tools. Now, you might be confused about which would be the best and with which you should go.
Let me clear your confusion. Below, I have provided the relevant and detailed difference between Excel vs Tableau. This will help you understand which is better and let you know more about both software. So, let’s dive into the details of both softwares.
A small beginner’s guide: What actually excel and tableau is!
Excel is a spreadsheet application powered by Microsoft office. It is used for various types of calculations in math.
Apart from that, it is also used for many statistical operations and analysis of data. Excel offers multiple handy tools to data analysts.
On the other hand, Tableau is one of the most powerful business intelligence tools. It is used for Querying and reporting.
Apart from that, it is quite helpful in online analytical processing and analytics. It is the best among the visualization tools.
In other words, we can say that tableau has begun to enhance business intelligence tools around the world. Besides this, business intelligence software grants the ability to visualize the work and data to non-technical users immediately.
Tableau enabled business intelligence analysts to be unconventional. Non-technical users can quickly upload the information within the program and start using it directly.
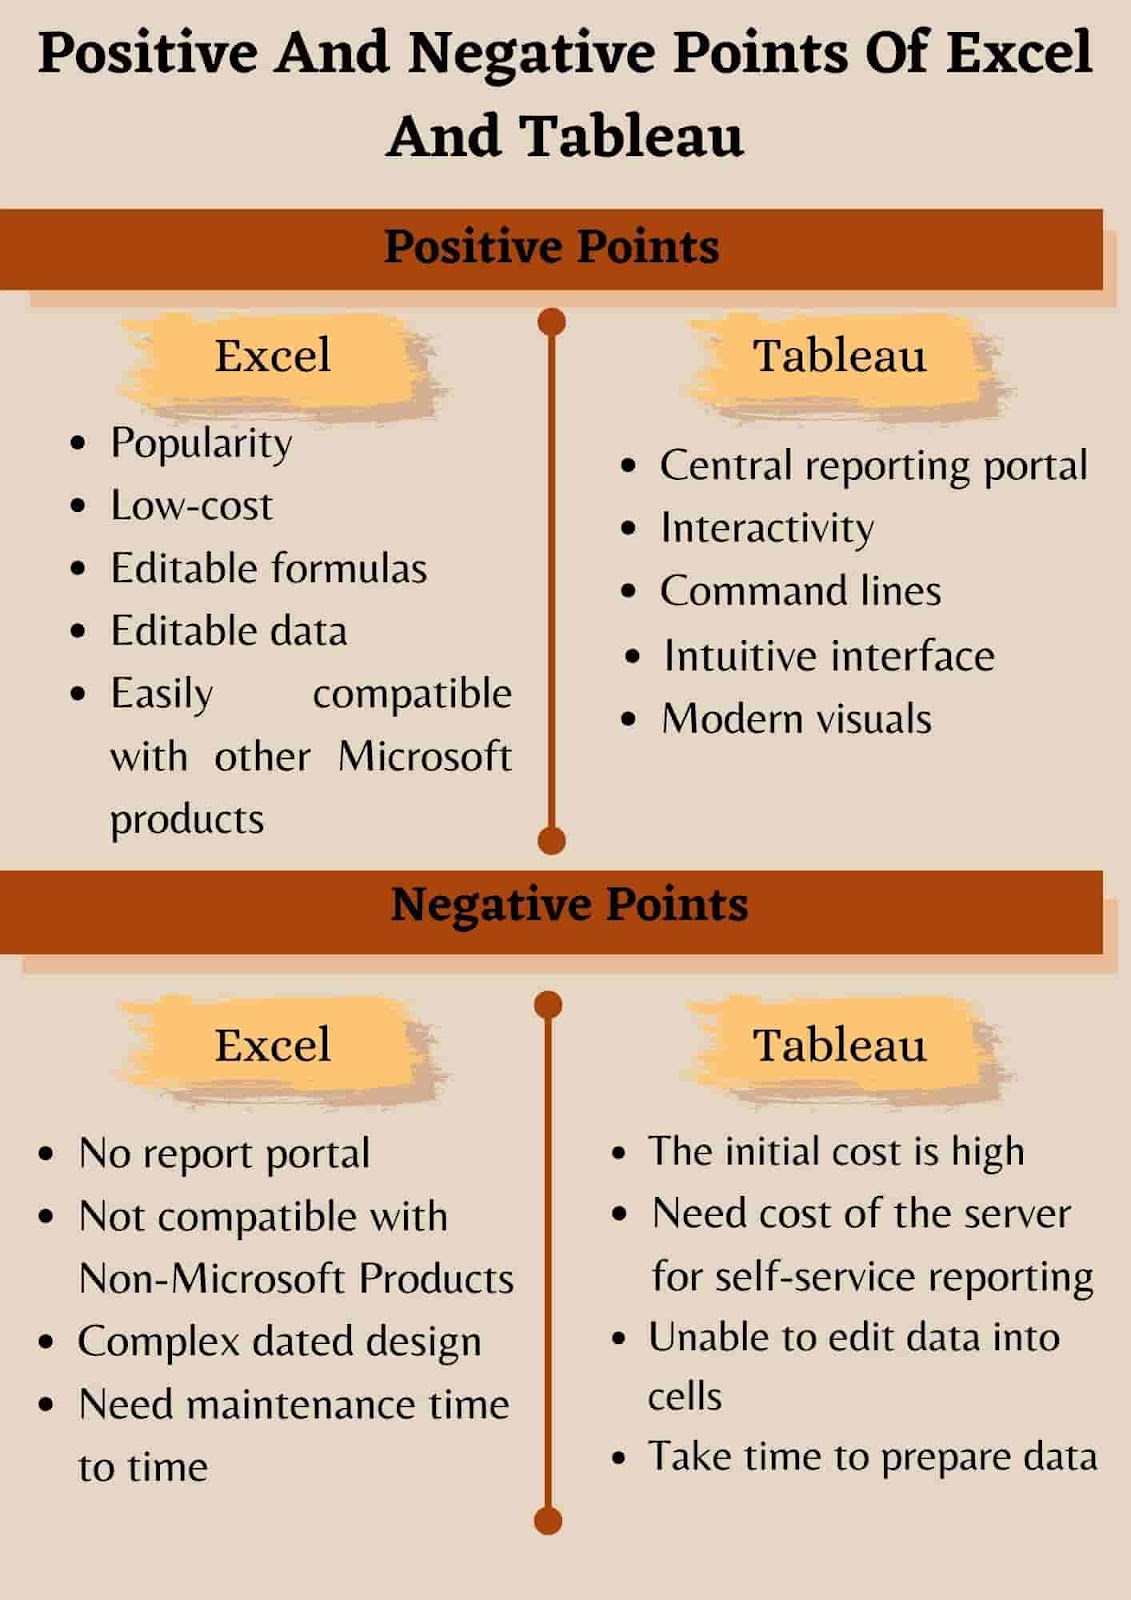
What are the positive and negative points of excel and tableau?
Table of Contents
Benefits Of Learning Excel And Tableau
| Excel | Tableau |
| Build data with tables and graphs Improve Skills Organize data easily Handle small and big data easily Best Job Opportunities | Create data visualization of a large amount of data quickly. Quickly create interactive plots. Secure Career Increasing demand for Tableau’s professionals Diverse Tableau Jobs |
Now let’s discuss the in-depth difference between Excel and Tableau.
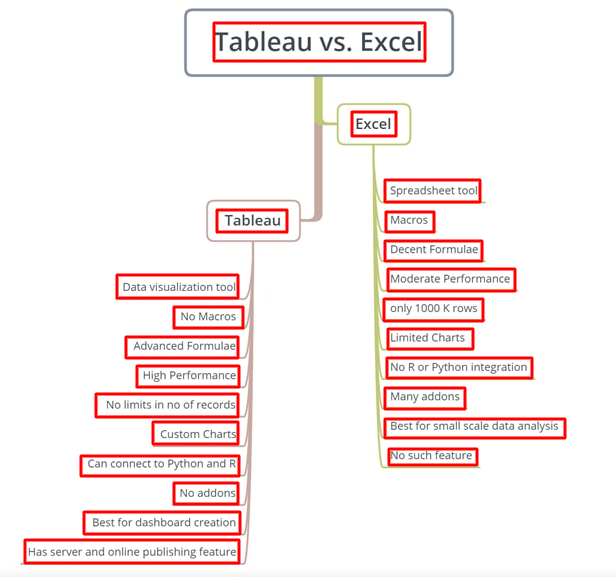
Tableau Vs Excel
Check the infographic to understand Excel vs Tableau in a better way!
Head to head comparison: Excel vs Tableau
Following table shows the comparison between Excel and Tableau.
| Parameters | Excel | Tableau |
| Definition | Excel software is used to format, organize, and calculate the data. | Tableau Software to visualize and represent the useful insights from the raw data. |
| Benefits | It manipulates descriptive statistics. | User-friendly, easy interactive visualizations. |
| Usage | To save the data & manipulations. | It is used for Data representation. |
| Business purpose | Excel easily creates on-off reports. | Self-service functions can easily pull the useful insights of the raw data. |
| Real-Time Usage | External programs or applications need to be set up to get real-time. | It offers various real-time interactive deals that work with the raw data. |
| Ease of use | Knowledge of macros and scripting (VB) to use it as full-fledged. | There is no need for coding skills. |
| Field | In various domains excel deals with data transformations. | Tableau offers business evaluations and key performance parameters. |
| Solution | It is best suited and applicable for small-scale and structured data. | Tableau provides insights into big data problems. |
| Stands out | Excel stands out the descriptive statistics. | Tableau saves a large volume of data. |
| Data-related problems | Excel has finite resources when dealing with large data. | Tableau easily deals with big data to provide relevant insights. |
| Applications | Developers, Data analysts, ETL DBA. | Data scientists, Data analysts. |
Detailed Comparison between Excel vs Tableau
Definition
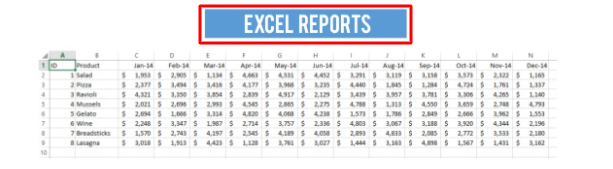
Excel is a spreadsheet application. The spreadsheet software is an electronic worksheet that displays the data in a tabular format. In excel, the data is stored in “cells.” And the data can be manipulated by manually set formulas.
The best part of excel is, it is an excellent tool for data visualization. You can use graphs, charts, or presentations to highlight a particular insight or dataset in excel.
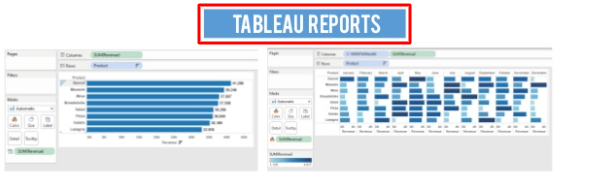
On the other hand, Tableau is a data visualization tool. Tableau format data in a pictorial or graphical view. It is helpful to quickly spot patterns, trends, or correlations between data points.
It grants users to combine various kinds of the dashboard in Tableau and charts that facilitate interactive analysis. Because of Tableau, one can save a lot of time if one transfers a pre-designed excel dashboard to Tableau. Upload new content and update visuals in Tableau.
The best feature of Tableau is it is connected to third-party tools to pull data. Apart from that, it has user-friendly functionality, like drag-and-drop features or drop-down menus. It allows users to explore data freely and more effectively.
Data Discovery
Data discovery is quite helpful for businesses to remain competitive in the markets. It helps enterprises to find critical insights into data. But the ability of data discovery entirely differs in Excel and Tableau.
Excel may not be an excellent option for data discovery. While working in Excel, you must think that the data should help you find critical insights. But excel has the advantage that it saves the data in tabular format.
It helps you to map out your path to insight. It does that with the help of building formulas, visualizations, and information analysis. But the worst part of excel is this entire process causes the problem of drilling down into the data less flexible. Thus it is making it harder to explore information on a granular level.
On the other hand, Tableau is the best software for data discovery. It allows you to explore data freely. You need not know the answer you want ahead of time.
It has built in drill-down and data blending features. With the help of these features, you’re able to spot correlations and trends. In the end, you can dig down to understand the causes of whatever happens with the data.
Automation Functionality
Automatic functionality helps the business in getting up-to-date data to make critical decisions. Both Excel and Tableau have great features to work with static and live data from multiple sources.
Excel allows you to refresh an Excel worksheet automatically. It involves some manually programming processes, i.e., creating macros. It helps you to automatically update the worksheet’s data whenever you open the file. You can create simple macros using Excel’s Power Pivot and macro recorder tools.
But if you want to create advanced macros or manipulate existing ones. Then you need to have some VBA (Visual Basic Application) knowledge.
When you create the macro for the very first time, then it may be time-consuming for you. But once it is created, it will reduce the time it takes to complete repetitive tasks in the long run.
On the other hand, Tableau is a little more intuitive with creating processes and types of calculations. Let’s understand it with an example when we create calculations in a tabular format.
Then we need to type the formula once. After that, it will be stored as a field and applied to all rows referencing that source.
In this way, Tableau allows you to create an application for the recurring process. Other than this one, you can also create custom formulas in Tableau. You will not find a custom formula feature in Excel’s Power Pivot table.
Visualizations
Visualization is the primary point between the comparison in Excel vs Tableau. Visualization is a process to highlight the most critical data in a given dataset.
Excel allows you to manipulate the data on the cell level. And then manually create visualizations like graphs, charts, PowerPoint presentations of your data.
To simplify your visualization creation in Excel, you need to have a deep understanding of how Excel’s features work.
On the other hand, Tableau is one of the most popular data visualization tools in the world. That’s why it visualizes data from the start. Thus it allows you to see the significance right away.
Apart from that, Tableau also differentiates correlations with the help of color, size, labels, and shapes. Thus it gives you context as you drill down the data.
Usage
The significant uses of Excel are to store the data and manipulate the data using various operations. Excel stores the data into the spreadsheet using cells. But you can organize the data into the cell as per your preferences.
Apart from that, excel also represents the data in an eye-catchy manner. You can use tables and graphs to serve the data in excel. It also provides various kinds of charts to represent your data.
On the other hand, the primary use of Tableau is data visualization. As we know, it is the best data visualization software. It also offers the best user-friendly interface that allows users to perform data visualization tasks efficiently.
The best part of Tableau is, you can integrate it with other software and tools to get the raw data. And then visualize this raw data with ease.
Business purpose
Businesses usually use excel in producing Quick on-off reports. Because it is quite easy to generate the report in excel.
It is the spreadsheet software that puts the data and then manipulates the data using some function. And finally, create the report in the shortest time without having the coding knowledge.
On the other hand, Tableau is a great tool to get insights from the data. It offers the self-service function that would pull the insights of the data.
The data analyst uses Tableau to get insight from the raw data. Most of the time, Tableau automatically imports the data from various sources.
Ease of use
Excel is easy to use the software as it offers spreadsheet functionality, which is quite easy for beginners to put the data and perform some basic mathematics operations.
But if you want to use excel to the extreme level, you need to know the script (VB). You should also know macros to use it full-fledged.
On the other hand, Tableau offers the best graphical user interface. It offers drag and drops functionality. It means you do not require any coding skills to use Tableau.
Applications
Excel is widely used by data analysts, Developers, and ETL. It provides the functionality to data analytics in performing their daily tasks.
On the other hand, Tableau is also popular among data analysts to get insights from the data. Apart from that, it is also used by data scientists to perform some insight operations on data.
Stands out
Excel is best for data manipulations and descriptive statistics. It is used by data analysts on a daily basis to perform data manipulation and descriptive statistics.
On the other hand, Tableau is best to visualize any size of data without any hassle. Apart from that, it is also helpful to store a large volume of data. In excel, there is a limitation of keeping the data.
Solution
Excel is not the most powerful software for a large corporation. Thus it is best applicable and suited for the small-scale corporation. Besides, it is also used for structured data.
You can’t use it for unstructured data because it will become overwhelming for you to process the unstructured data in Excel.
On the other hand, Tableau is a great tool to get insight from the big data problems that are being represented.
Besides, it is also used in large enterprises, and you can also use unstructured data in Tableau. It has the ability to process unstructured data with ease.
Era
The world is changing at a rapid pace. Therefore the businesses are looking for more enriching data visualization tools to view the insights from the data that can impact the business.
That’s why they prefer Tableau over excel. The reason is Excel has some essential features for data visualization. But it is a traditional structured tool. And it was also found in the late 90s.
On the other hand, Tableau was founded in 2003. It also offers modern features to visualize the data.
Now it is a product of Salesforce, which has provided more power to this tool. Both software gets the updates at regular intervals, but still, excel is a bit more ancient than Tableau.
Integration
Excel offers integration functionality to users. You can connect Excel to different external sources with the help of some plugins. On the other hand, Tableau has many sources to connect.
Apart from that, Tableau is also having the capability of a cloud. But if you want to integrate any sources to excel, then you need to have some system requirements.
But if we talk about Tableau, it is much easier to make live connections to external sources. It provides faster speed and access to connect with external sources.
A user who is new to Tableau can be disappointed while linking to excel spreadsheets directly. Tableau performs the information points automatically to classify areas and set up a suitable workspace.
Versions
Excel is a Microsoft licensed software. It comes with Microsoft office. Thus it gets its version with every new version of Microsoft office, i.e., office 2019.
On the other hand, the versions of Tableau. Tableau has multiple versions of desktop, server, and cloud-based. You can pick either one as per your requirements.
Statistics vs Dynamic
Excel is a static tool because we load the data first and then get the representation of the data.
Excel also allows us to import the Data from External sources by using some plugins. But to use excel to its full potential, then you need to have advanced knowledge of the features and the functions.
On the other hand, a Tableau is a dynamic tool in nature. It can pull the data from external sources in real-time.
You can also use that data on the spot to get insight from that data. Data analytics use Tableau for various purposes.
For this, Tableau need not require any complex script. The users can have easy access to its function because of its user-friendly interface.
Data analysts use Tableau for many purposes. It does not require any complex scripting — easy access and user-friendly.
Cost
Excel is not a single product launched by Microsoft. If you want to purchase MS Excel, then you need to buy the entire MS office.
There are two ways to purchase the MS office; the first is the offline version, where you need to pay a one-time fee, i.e., $439.99.
You can also get a yearly subscription to office 365. Its charges are office 365 home for $99.99/ year, personal for $69.99, and office home. You can check the latest pricing of MS office at MS office Pricing.
On the other hand, Tableau offers three different types of subscriptions to users. All these subscriptions are as follows: the creator, explorer, and viewer.
All these packages are charged monthly. You need to pay $70 for the creator plan.
While on the other hand, you need to pay $35 for the desktop version and $42 for the cloud deployment. You can check the latest pricing of Tableau at Tableau Pricing.
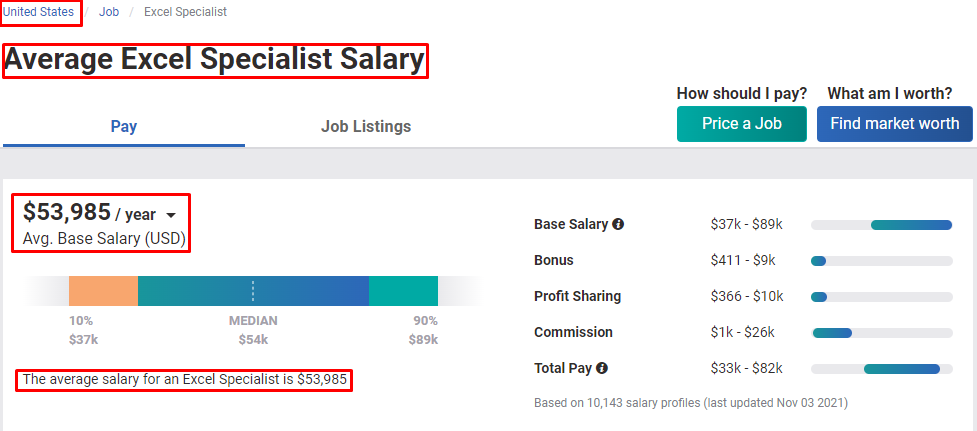
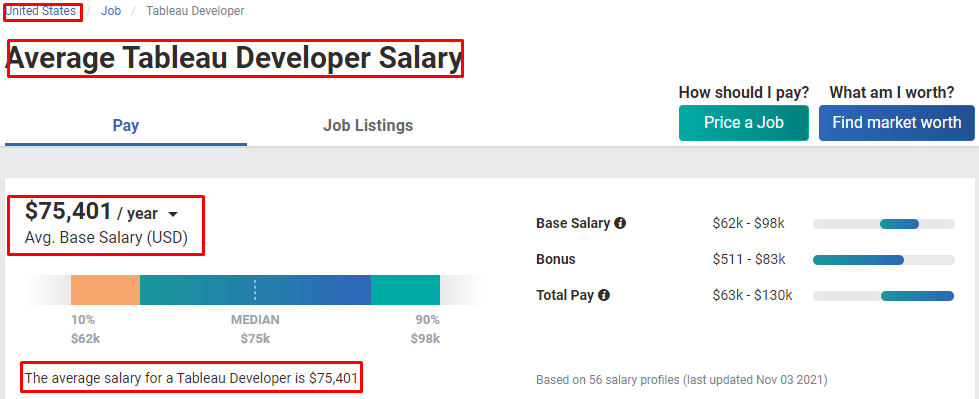
Excel or Tableau: Which one offers the best salary package?
If we talk about the salary package, then it is quite clear that Tableau offers more salary than excel. But, it does not mean that excel is not offering you a good salary package.
Excel and Tableau have their own specialties. That is why you can easily use them for different applications and purposes. It would always be beneficial if you have knowledge of both software.
So, try to develop both skills and earn more money. Apart from this, both software is in high demand. That is why they offer more job opportunities. Therefore, you do not need to worry about your career when you are learning Excel or Tableau.
Conclusion
Now you have got the in-depth comparison between Excel vs Tableau. From this comparison, you may be confused with the question “IS TABLEAU BETTER THAN EXCEL”?
Well, Tableau is extremely better at making live links to the outside resources with ease of access and speed. Tableau grew as a buzz into the market due to its data issues that various organizations face.
On the other hand, excel has defined sources while it is considered in terms of data. Excel has limited columns and rows during usage. But these are both used for data analysis.
However, tools like tableau have an additional feature that Business Intelligence (BI) analysts use.
Finally, I would like to say that a skilled analyst requires both Excel and Tableau since they utilize different goals. Tableau is better when it is about dashboards and visuals, and excel is a spreadsheet element that must perform multi-layered calculations. If you want to have the tableau assignment questions. Then you can submit your requirement with us to get the best tableau assignments for beginners at nominal charges.
Is Tableau A free software?
Yes, Tableau public is one of the free software, which enables the user to connect to the files and spreadsheet. With the help of it, users can create interactive data visuals for the web. Also, the Tableau reader is free that enables interaction with different data visuals made on the Tableau desktop.
Why is Tableau so popular?
Tableau is used more frequently as the tool enables us to analyze the data more quickly, and visualizations are generated as dashboards and worksheets. Tableau allows us to make dashboards that give actionable insights and spread the business faster.

