Statistics math problems are not only necessary to understand the math question in depth, but it also makes you familiar with real-time things more efficiently. Therefore, it is always important to understand what statistics are and how statistics relate to math.
Don’t have any knowledge of it? No worries!! I will help you know what exactly statistics math problems are and how they are useful.
Attention
Table of Contents
Being a statistics subject student, it is necessary that you must have enough knowledge about statistics questions. Moreover, practice the problems as much as you can. It will help you to clear your doubts and strengthen your conceptual knowledge.
So, let’s check what exactly the statistics math problems are.
What Are The Main Terminologies Used In Statistics?
Just as other subjects, statistics has its own terms and language. This language supports you to understand what actually the problem is, what result requires to come, and methods to describe and analyze the results in the right manner.
Let’s Check Some Of The Main Terminologies Used In Statistics:
| A statistic is a sample’s quantitative aspect, which helps in estimating or testing the population parameters. It is of two types (that you have also studied in your schools): Descriptive statistics represent the result that you conclude at the time of analyzing the data set, like mean, median, mode, standard deviation, and more.Statistical inference is used to draw useful conclusions related to the population—for example, hypothesis test and regression confidence intervals. |
| The population represents the whole group of people that you need to study. (NOTE: Sample statistics is the subset of this entire group). |
| A parameter is one of the quantitative characteristics of the given population in which you need to take interest in tests and estimations. |
| Key point: What do statistics math problems look like? Well, before understanding the method to solve statistics math problems, you must consider what these problems look like.  The problems are mostly given with the details or tables that look like any survey outcomes. As per the table, you need to calculate some of the major terms of statistics, such as mean, median, mode, and so on. But first, you must know all the useful formulas and methods to solve the statistics math problems. [If you do not know how to solve these problems, don’t worry. Scroll down to check the method to solve statistics questions.] |
What Are Some Problems With Statistics?
There are some of the major problems that can occur when you deal with the statistics data. Therefore, it becomes necessary that you must understand these problems and keep in mind to ignore them.
1. Sometimes Extracting Meaning Can Make A Little Difference
When you look for the difference across subgroups and groups for findings, it explains if the percentage difference is large enough to make conclusions or not.
Therefore, you need to be careful when you deal with the small difference as it can lead to no meaning for making conclusions.
2. Poor Survey Designs
The statistics quality directly depends on the survey quality. But sometimes, we design a survey with free tools and use the survey output for important decision-making.
That is why you must take care of the survey design to help you make important decisions. It is beneficial if you assign this to an expert who knows how to perform surveys.
3. Representing Meaningless Details On A Graph
Sometimes, the graphs can misguide the readers. The graphs like bar graphs can show the bar of large value where the small value might look to be ignored.
But actually, small values also play a significant role in the statistics data. Therefore, you must use a suitable graph to represent the data.
How To Solve Statistics Math Problems?
It has been seen that solving statistics questions needs some strategies. That is why below, I have mentioned important strategies or steps to solve these problems. Let’s find out.
Label Each Point Of The Problem Or Question Assigned To You
Suppose your statistics questions state that A is the normal distribution with a mean value of 5 and the standard deviation (SD) with 1. Then, circle all the numeric terms and write the respective symbols. Like circle 5 and write μ, and so on.
Write What The Question Demands To Find Out Statistically
Suppose you assign to calculate the probability of the more than 5 people who joined a competition. Then, write it as “Calculate P(X > 5).”
Also Read
- What is dependent variable in math
- What is term in math
- A useful guide on what is constant in math
Recall the formula you studied to calculate a similar problem or question while practicing the problem. And connect it with the current statistics math problems.
Suppose your problem topics already have some terms like Standard deviation as 3, mean like 80, and so on. And you need to calculate the probability of x that is less than 80.
You can see that the z-formula (Z = (X – μ)/σ) can be relevant to solve this kind of problem. Put all the values in the formula. Now you can easily find out the value or the answer to your statistics math problems.
Let’s check a statistics math problem and solve it!!!
Two brothers, James and Caroline, are studying in the same class. The following is the table of their marks they got the whole year in their test.
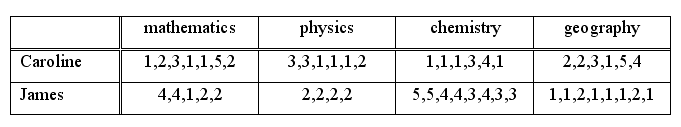
Calculate in how many subjects Caroline scored better than the brother James. (The mark ranges from 1 to 5.)
Solution
As you can see that we need to calculate the statistical average or mean of each subject that looks like:
Caroline’s average marks:
mathematics: (1+2+3+1+1+5+2)/7 => 15/7 => 2.14 => 2 (approx)
physics: (3+3+1+1+1+2)/6 => 11/6 => 1.83 => 2 (approx)
chemistry: (1+1+1+3+4+1)/6 => 11/6 => 1.83 => 2 (approx)
geography: (2+2+3+1+5+4)/6 => 17/6 => 2.83 => 3 (approx)
James’ average marks:
mathematics: (4+4+1+2+2)/5 =>13/5 => 2.6 => 3 (approx)
physics: (2+2+2+2)/4 => 8/4 => 2
chemistry: (5+5+4+4+3+4+3+3)/8 => 31/8 => 3.88 => 4 (approx)
geography: (1+1+2+1+1+1+2+1)/8 => 10/8 => 1.25 => 1 (approx)
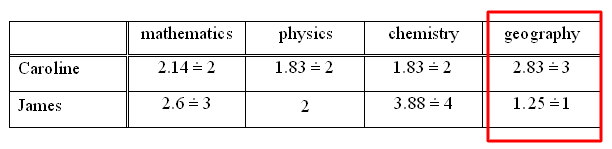
So, Caroline got better marks in one subject (that is geography) than James.
This is how you can understand and solve the statistics math problems in an easy manner.
| Practice these statistics math problems on your own!! |
The below table has the data of measured heights of all 63 students with its corresponding numbers as: 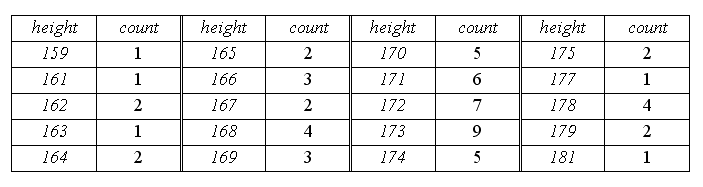 Calculate the mean, median, mode, variance, and SD of each student’s height. Correct Answer: x̄ = 170.8, med = 171, mod = 173, s^2 = 21.87, s = 4.7. |
When we weigh 20 of 1Kg tea bags, the following are the measured values that we have noted in kgs:  Calculate the median and the variance of all the calculated weights. Correct Answer:med(x) = 1, s^2 = 0.0012 |
Applications Of Statistics In The Real World In 2023
Here are some applications of statistics in the real world in 2023:
1. Business and Finance
Statistics plays a vital role in business decision-making and financial analysis. It is used for market research, forecasting sales trends, risk assessment, portfolio management, and evaluating investment opportunities.
2. Healthcare and Medicine
Statistics is used in medical research to analyze clinical trials, study disease patterns, evaluate treatment effectiveness, and assess public health trends. It helps make informed decisions about patient care, drug development, and healthcare resource allocation.
3. Sports Analytics
Statistics is widely employed in sports to analyze player performance, evaluate team strategies, and make data-driven decisions. It helps in player scouting, game strategy planning, performance tracking, and predicting outcomes.
4. Social Sciences
Statistics is extensively used in social sciences like sociology, psychology, and economics. It helps researchers analyze survey data, conduct experiments, study population trends, and draw meaningful conclusions about human behavior and societal patterns.
5. Environmental Analysis
Statistics is used in environmental studies to analyze climate data, monitor pollution levels, assess ecological impacts, and model environmental phenomena. It helps in understanding climate change, making policy decisions, and implementing sustainable practices.
6. Market Research and Consumer Behavior
Statistics is used in market research to analyze consumer behavior, conduct surveys, and gather data on preferences and buying patterns. It helps businesses understand customer needs, develop targeted marketing strategies, and optimize product offerings.
7. Quality Control and Manufacturing
Statistics is employed in quality control processes to monitor product quality, detect defects, and ensure consistent manufacturing standards. It helps in statistical process control, reliability analysis, and optimizing production efficiency.
Tips For Improving Your Statistics Math Skills
Here are 5 tips for improving your statistics math skills, each in 2 lines:
1. Practice Regularly
Make it a habit to practice solving statistics problems regularly. The more you practice, the better you apply statistical concepts and techniques.
2. Understand The Concepts
Instead of just memorizing formulas and procedures, try to understand the basic ideas behind statistical calculations. This will help you grasp the reasoning and logic behind statistical analyses.
3. Use Real-Life Examples
Apply statistics to real-world situations to develop a practical understanding of how statistical concepts are used. Analyze data from everyday scenarios like surveys, sports, or social media trends.
4. Seek Help When Needed
Do not hesitate to ask for help if you are stuck on a concept or problem. Consult your instructor, classmates, or online resources to get guidance and clarification.
5. Review And Reflect
After solving problems, take the time to review your work and reflect on your approach. Understand any mistakes you made and learn from them to improve your problem-solving skills.
Conclusion
Statistics math problems can be useful to make a better understanding of how to use statistics concepts. Therefore, it is always necessary that you must know the method to solve these problems.
I have detailed the necessary steps along with other useful information. Bookmark this website and understand the concepts of statistics.
Still have any doubt, then let me know through your comments. I will help you to understand statistical concepts. If you still have some doubts then get best math homework help to clear then in real time.
“Be a great statistician with enough knowledge about statistics with our useful blogs.”
Frequently Asked Questions
What is Statistics math with examples?
Statistics consider as the number that shows or describes the sample’s properties. For example, suppose you consider a math class as the sample of all math classes. The mean value of the marks scored in the particular math class in the final exam is the statistics example.
What type of math is used in statistics?
The particular math techniques used in the statistics are as follows:
linear algebra,
differential equation,
mathematical analysis,
stochastic analysis,
measure theory.
Why do we rely on statistics?
With the help of statistical knowledge, you can collect helpful data, develop valuable insights by analyzing the data, and develop useful decisions. Moreover, statistics play an essential role in various scientific discoveries, data-based decisions, and making predictions.