
Excel is widely used for data analysis and statistics. As we all know, we can perform various types of mathematics and statistical methods in Microsoft Excel as per our requirements. Finding the standard deviation in Excel is very easy. You need to know which formula has to be applied to find the standard deviation.
Many people needed clarification in this part because they needed to know which formula should be applied. In this article, you will find all your answers related to the standard deviation. You will get all the knowledge you need about how each standard deviation formula works. And which standard deviation formula will be best according to your data and requirements?
Let’s get started with the standard deviation in Microsoft Excel. Whether you are a student, businessman, employee, or just getting started with Microsoft Excel, learning how to find the standard deviation in excel is essential for all.
What is a standard deviation?
Table of Contents
The standard deviation is a statistical method for calculating how much the data set deviates from its mean. This method is very useful for understanding your data; it will tell you how similar or dissimilar your given data is.
There are many types of formulas Microsoft provides us to perform the standard deviation. Each method or formula will be used for a different purpose. This all depends on what kind of action you want to take with your data.
| Also Read: Importance of Standard Deviation |
Why do we use the standard deviation?
Several reasons will explain why we use the standard deviation.
1. Understanding How Data Varies
When you look at numbers like sales figures or exam scores, the average tells you the middle point but not how much the numbers differ from that point. The standard deviation shows you how much the numbers spread out from the average, giving you a better understanding of the data.
2. Making Better Decisions
Knowing the standard deviation helps you make better decisions. For example, if two groups of students have the same average score but different standard deviations, the group with the higher standard deviation has more varied scores. This might mean you need to pay closer attention to that group.
3. Measuring risk
In areas like finance, the standard deviation is used to measure risk. A higher standard deviation means more uncertainty because the numbers are more spread out. Excel makes it simple to calculate this, so you can quickly assess the level of risk and make more intelligent choices.
4. Saving Time with Accurate Calculations
Calculating the standard deviation by hand can be tedious and prone to mistakes. Excel’s built-in functions, like STDEV.P (for entire data sets) and STDEV.S (for samples), do the work for you, ensuring you get accurate results without the hassle.
5. Visualizing Data Clearly
Excel lets you add standard deviation bars to charts, giving you a visual way to see how much the data varies. This makes it easier to compare different sets of numbers and quickly spot patterns or differences.
Types of Standard Deviations in Microsoft Excel
Microsoft Excel provides us with six types of standard deviation formulas. Two additional standard deviation formulas are used only for the database. If we add those two formulas, we get a total of eight standard formulas. But we mostly work on those six formulas unless we work on the database.
1. STDEV.S (Sample Standard Deviation)
- What It Does: This function calculates the standard deviation when you have a sample, or a small part, of a larger group. For example, if you’re analyzing a few test scores to represent the performance of all students, you’d use STDEV.S.
- How It Works: It adjusts the calculation to be more accurate because it knows you’re only working with a sample, not the whole group.
2. STDEV.P (Population Standard Deviation)
- What It Does: This function calculates the standard deviation when you have data for an entire group or population. For example, if you have test scores for all students in a school, you’d use STDEV.P.
- How It Works: It calculates the exact spread of the data without any adjustments since you’re dealing with all the data.
3. STDEVA (Sample Standard Deviation, Including Text and Logical Values)
- What It Does: Similar to STDEV.S, but it also includes text and logical values like TRUE or FALSE.
- How It Works: In this function, TRUE is counted as 1, and FALSE (along with any text) is counted as 0. It’s useful when your data set includes these kinds of values, and you want them included in the standard deviation calculation.
4. STDEVPA (Population Standard Deviation, Including Text and Logical Values)
- What It Does: Similar to STDEV.P, but it includes text and logical values in the calculation.
- How It Works: In this function, TRUE is counted as 1, and FALSE (along with any text) is counted as 0. It’s useful when your data set includes these kinds of values and you want them included in the standard deviation calculation.
5. STDEV (Older Version of Sample Standard Deviation)
- What It Does: This is an older version of STDEV.S, which calculates the standard deviation for a sample.
- How It Works: It does the same job as STDEV.S by adjusting the calculation for sample data but is mainly kept in Excel for use in older spreadsheets.
6. STDEVP (Older Version of Population Standard Deviation)
- What It Does: This is the older version of STDEV.P. It calculates the standard deviation for an entire population.
- How It Works: It works the same way as STDEV.P, providing an exact measure of how spread out the data is across the entire group, but it’s kept in Excel for older files.
In Short:
- STDEV.S and STDEV.P are the most commonly used functions for sample and population data.
- STDEVA and STDEVPA include logical and textual values in their calculations.
- STDEV and STDEVP are older functions kept for compatibility with older Excel files.
How to Find the Standard Deviation in Excel
Here is a step-by-step guide for how to find the standard deviation in Excel.
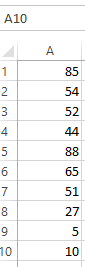
Step 1: Enter your data
- Open Excel and input your data:
- Type your data into a single column or row. For example, if you have 10 test scores, enter each score into a separate cell in a single column (like A1 to A10).
Step 2: Choose the Right Function
You need to pick the right standard deviation function based on whether your data is a sample (a part of a bigger group) or the entire population.
- STDEV.S (Sample Standard Deviation):
- When to Use: If your data is a sample, meaning it’s just a part of a larger For example, if you’re analyzing scores from just a few students out of an entire school, use STDEV.S.
- STDEV.P (Population Standard Deviation):
- When to Use: If your data represents the entire group or population, For example, if you have the test scores for every student in the school, use STDEV.P.
- STDEVA and STDEVPA:
- When to Use: If your data includes text or logical values like TRUE or FALSE. These functions work similarly to STDEV.S and STDEV.P, but they include those special values in the calculation.
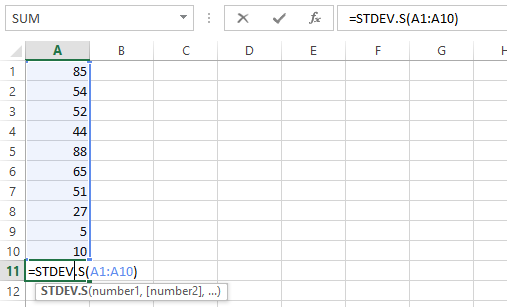
Step 3: Enter the formula
- Select the cell for the result:
- Click on the cell where you want Excel to display the standard deviation.
- Type the formula:
- Start by typing = to begin the formula.
- Use the right function based on your data:
- For a sample: Type =STDEV.S(A1:A10) (assuming your data is in cells A1 to A10).
- For a population: Type = STDEV.P(A1:A10).
- For data with textual or logical values: use STDEVA for samples or STDEVPA for populations.
- Press Enter:
- Press Enter after typing the formula. Excel will calculate the standard deviation and show the result in the selected cell.
Step 4: Understand the Result
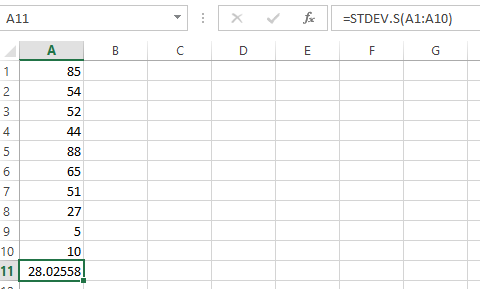
- The number you get is the standard deviation. This tells you how much your data varies from the average:
- Low Standard Deviation: Data points are close to the average, meaning they’re consistent.
- High Standard Deviation: Data points are spread out, showing more variation.
Example
Imagine you have test scores of 85, 90, 78, 88, 92, 75, 91, 89, 84, and 77.
- Enter these scores into cells A1 to A10.
- For a sample: Use the formula = STDEV.S(A1:A10) if you’re only looking at a small group of students.
- For the whole group: Use =STDEV.P(A1:A10) if you have all the test scores.
Additional Tips
- Updating the Range: If you add more data, just update the range in your formula. For example, if you add scores in A11 to A15, change the formula to = STDEV.S(A1:A15).
- Other Tools: You can also use Excel’s AVERAGE function to find the mean (average) and VAR.S or VAR.P to find the variance, which is the square of the standard deviation.
Shortcuts and Tips for Calculating Standard Deviation in Excel
Here are some easy shortcuts and tips for calculating the standard deviation in Excel:
1. Add to the Quick Access Toolbar
- What It Does: Adds standard deviation functions to the Quick Access Toolbar for quick access.
- How to Do It:
- Go to File > Options > Quick Access Toolbar.
- In the “Choose commands from” dropdown, select All Commands.
- Find STDEV.S, STDEV.P, STDEVA, or STDEVPA and add them to the toolbar.
2. Use AutoSum
- What It Does: Quickly calculates the standard deviation using the AutoSum feature.
- How to Do It:
- Click on a cell below or to the right of your data.
- Click the AutoSum button (Σ) in the Home tab.
- Select More Functions > Statistical, then choose STDEV.S or STDEV.P.
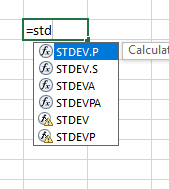
3. Formula AutoComplete
- What It Does: It helps you quickly insert the right standard deviation function.
- How to Do It:
- Start typing STDEV in a cell.
- Excel will suggest functions like STDEV.S or STDEV.P. Press Tab to select and complete the function.
4. Use the Formula Wizard
- What It Does: Assists with inserting the right function.
- How to Do It:
- Click the cell where you want the result.
- Press Shift + F3 to open the Insert Function dialog.
- Type STDEV in the search box and choose the function you need.
5. Keyboard Shortcuts for Formulas
- What It Does: Makes entering and editing formulas quicker.
- How to Do It:
- To enter a formula, type = followed by the function name (e.g., =STDEV.S(A1:A10)), then press Enter.
- To edit a formula, click the cell, press F2, make your changes, and press Enter.
6. Copying formulas
- What It Does: Quickly applies the formula to other cells.
- How to Do It:
- Enter the formula in one cell.
- Drag the fill handle (small square at the bottom-right of the cell) to copy the formula to adjacent cells.
7. Use named ranges
- What It Does: Makes formulas easier to read by naming your data ranges.
- How to Do It:
- Select your data range.
- Go to the Formulas tab and click Define Name.
- Enter a name (like Scores) and click OK.
- Use this name in your formula (e.g., =STDEV.S(Scores)).
Example Shortcuts
- To calculate the sample standard deviation:
- Type STDEV.S(, select your data range, and press Enter.
- To calculate the population standard deviation:
- Type STDEV.P(, select your data range, and press Enter.
These tips will help you use standard deviation functions more efficiently in Excel!
Final Words
The standard deviation is an easy and effective method that we use in statistics. Using the standard deviation method in Microsoft Excel is easy and very helpful for our work and data. In this guide, you will get all the knowledge you need about standard deviation and its different types of methods. All those methods work differently according to the user-given data and its needs.
Learning how to find the standard deviation is important for all Excel users. We need to use this method many times in our work or our assignments. That is why learning the standard deviation matters for all. In this guide, you must have all the answers to your question about the standard deviation.
Also Read
- Where Can You See The Excel Application Being Useful In Your Life?
- How to Find Z Score in Excel | Best Ways to Find it Like A Pro
- Learn About Excel & Topics of Excel Assignment For Students
- Excel vs Tableau: The Comparison You Should Know
- Top Tips from The Experts on How to Learn Excel
What’s the difference between STDEV.S and STDEV.P?
Use STDEV.S if your data is just a sample of a larger group. Use STDEV.P if your data includes the whole group. STDEV.S makes adjustments for samples, while STDEV.P uses the whole data.
Can the standard deviation be negative?
No, the standard deviation can’t be negative. It’s always a positive number or zero, showing how spread out the data is.
How do I understand a high or low standard deviation?
A high standard deviation means the data points are spread out a lot from the average. A low standard deviation means they are closer to the average, showing less spread
How should I handle outliers in standard deviation calculations?
Outliers can affect the standard deviation. If you think outliers are skewing your results, consider removing them or using methods that reduce their impact.
Can I calculate the standard deviation for a large data set?
Yes, you can calculate the standard deviation for large data sets in Excel. Excel handles large amounts of data well, and you can use features like AutoSum and named ranges to make it easier.