Data Science is the most popular and revolutionary technology in the current scenario. The first step in every data science project is to describe, visualize and summarize the data. Those people who examine the features and attributes of data by descriptive statistics always create the best models. Descriptive statistics provide insights and numerical summaries of data that help anyone handle and understand data more efficiently. SPSS is very popular software that most statisticians use to analyze a big data set and run multiple tests. Therefore, beginners generally search for how to do descriptive statistics on SPSS. And, this blog will describe the steps to perform descriptive statistics on SPSS. Moreover, you can also hire our experts for SPSS Assignments at an affordable price.
First of all, it is necessary to understand what descriptive statistics and SPSS are.
What is Descriptive Statistics?
Table of Contents
Descriptive statistics are the descriptive coefficients that are used to summarize the given data set. This can be the representation of entire data or a sample of a population. In short, Descriptive statistics describes the features of a particular data by providing short summaries about data.
The measures of the center are the most recognized types of descriptive statistics. These measures, i.e., mean, median, and mode, are used mostly in every level of math and statistics.
Descriptive statistics is mainly used for two purposes.
- Firstly, For providing the basic information of the variables in the dataset.
- Secondly, For highlighting the possible relationships between variables.
Descriptive Statistics can represent difficult to understand insights of large data sets into small size descriptions. For instance, the GPA (Grade Point Average) of a student is the small number representing the overall performance of a student.
What is SPSS Software?
SPSS stands for Statistical Package for Social Science. It is a software package that is very useful in complex statistics data analysis. SPSS Inc. launched SPSS in 1968, which IBM later acquired in 2009.
Due to its English-like commands and simple user manual, it is widely used by marketing organizations, education researchers, government, data miners, and many others for processing and analyzing data. Most of the successful research agencies use SPSS to mine text data and analyze survey data for best results. Therefore, it is preferable to perform descriptive statistics on SPSS.
Steps to Perform Descriptive statistics on SPSS
The various Steps to calculate Descriptive statistics on SPSS are given below-
Input Data in SPSS
SPSS allows manual data insertion as well as data import from various sources. The steps to import data from excel are as follows-
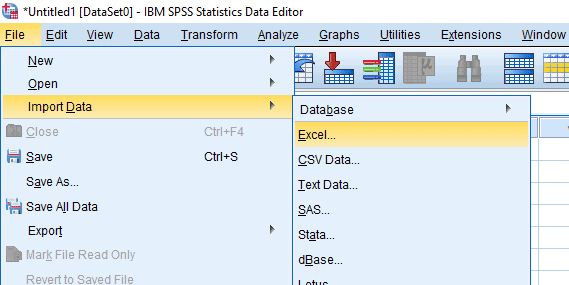
- Firstly, Select ‘File’ from the menu.
- Secondly, Choose Import Data>Excel.
- Thirdly, Look for data in the file manager and click ‘Open’.
- Lastly, Select the range of cells and click ‘OK’.
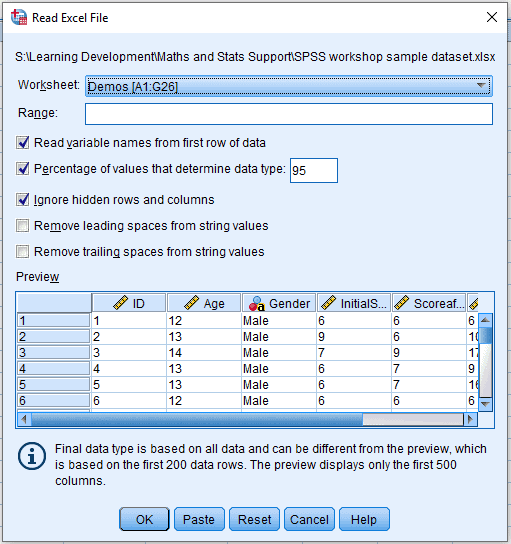
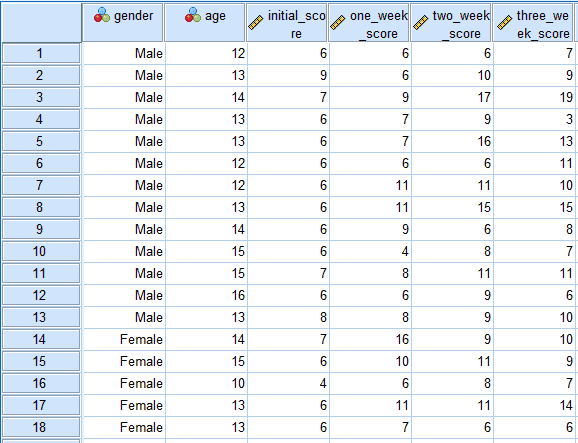
After importing the data in SPSS, click on the ‘Variable View’, and this sheet will open.
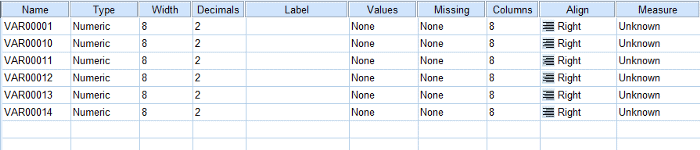
SPSS allows anyone to perform changes here according to his convenience to set up the variables correctly. After making the necessary changes click on the ‘Data View’ option in the bottom corner of the screen, and this screen will appear.
Descriptive Analysis SPSS
After inserting the data in SPSS software, the next step is to perform descriptive statistics using SPSS. To calculate descriptive statistics the various steps are given below-
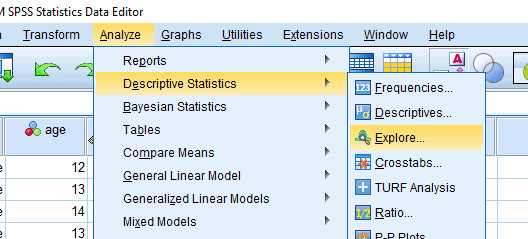
- Firstly, Go to the ‘Analyze’ in the top menu and select ‘Descriptive Statistics’ > ‘Explore’.
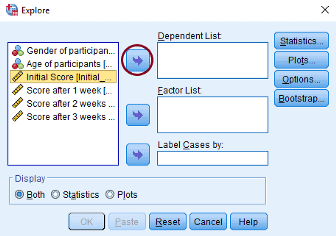
2. Now a pop-up window will appear. Click on the variable and select the blue arrow to insert the targeted variables in the ‘Dependent List’ box.
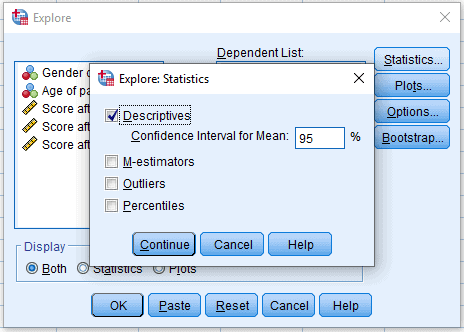
3. Thirdly, click on ‘Statistics’, tick the ‘Descriptives‘, and press ‘Continue‘.
4. Lastly, click on ‘OK’, and SPSS will produce the final results.
Steps On How To Calculate Descriptive Statistics for Variables in SPSS
Here are the steps on how to calculate descriptive statistics for variables in SPSS:
Step 1: Open Data File
Load your data file in SPSS containing the variables for which you want to calculate descriptive statistics. Go to “File” and select “Open” to load your data.
Step 2: Select Analyze
Click on the “Analyze” menu at the top, then choose “Descriptive Statistics” and finally, “Descriptives.” This opens up the Descriptives dialog box.
Step 3: Choose Variables
Select the variables from the list you want to analyze and move them to the “Variables” box. You can either double-click on the variable names or use the arrow buttons.
Step 4: Options and Statistics
In the Descriptives dialog box, you can choose additional options like calculating percentiles, quartiles, and other statistics. Click on the “Options” button to access these choices.
Step 5: Run Descriptive Analysis
Click the “OK” to run the analysis. SPSS will generate a new output window containing the descriptive statistics for the selected variables, including measures of central tendency, dispersion, and other relevant information.
Applying these simple steps lets you easily generate descriptive statistics for your variables in SPSS and learn important things about your data.
Why is SPSS best for Descriptive Statistics?
There are several software options available that can produce descriptive statistics. Now, the question is why SPSS is a good choice for performing descriptive statistics.
Some of the reasons supporting this argument are as follows-
1. Simplicity
SPSS is very easy to use for every community. Even beginners who don’t have any knowledge of coding or statistics can comfortably use SPSS.
2. Complete Numerical Analysis
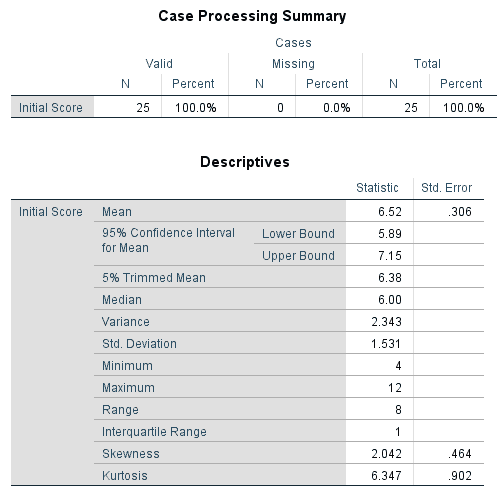
SPSS provides the whole descriptive statistics analysis in numerical form.
Anyone can easily produce a measure of dispersion, i.e., standard error, variance, range, standard variance, kurtosis, and skewness. Moreover, anyone can also measure central tendency that consists of mean, median, and mode as the necessary and most popular analysis.
Furthermore, Quartile, minimum, maximum, and percentile are also possible as a measure of position.
3. Customization
SPSS provides full control over the descriptive statistic. Therefore, It is completely the choice of the user about what to display and whatnot. Anyone can easily customize it with few clicks.
4. User-Friendly Interface
SPSS offers an intuitive and user-friendly interface that streamlines the process of generating descriptive statistics. Its well-designed layout and clear options provide a seamless experience, even for those relatively new to statistical analysis. This interface minimizes the learning curve and accelerates the proficiency with which users can perform descriptive statistics, making it an attractive choice for many users.
5. Established and Widely Used
SPSS has a strong reputation and a long history of being utilized for data analysis, including descriptive statistics. Its popularity and widespread adoption in various fields, such as social sciences, business, and research, testify to its effectiveness and reliability. Many educational institutions, professionals, and researchers are familiar with SPSS, which enhances its appeal as a go-to tool for performing descriptive statistics, especially in scenarios where compatibility and familiarity are essential.
Conclusion
This blog has given every information about how to do descriptive statistics on SPSS. The information about why SPSS is a great choice for performing descriptive statistics is also mention. Descriptive statistics is also known as summary statistics as it summarizes the large data sets. Moreover, it helps the data analysts in understanding the data better.Therefore, newbies generally want to know the process of calculating descriptive statistics on SPSS. To help them out, we included all the steps to generate descriptive statistics on SPSS. We also provide help with spss service to help you in every SPSS difficulty.
Frequently Asked Questions
Q1. Can you compare two data sets in SPSS?
SPSS allows you to compare two sets of data. You can employ tools like t-tests or ANOVA (Analysis of Variance) to determine if there are noteworthy differences between these sets. These tests help you understand if the variations you observe are likely due to actual differences or if they could have happened by chance.
Q2. What are the three types of variables in SPSS?
Within SPSS, variables come in three main types. Categorical variables deal with groups or labels like “yes” or “no.” Ordinal variables involve ranked values, such as survey responses with levels like “strongly disagree” to “strongly agree.” Lastly, continuous variables encompass measured quantities like height or weight, which can take any numeric value. Recognizing these variable types aids in selecting the right analyses for your data.

