
Do you know what Analysis of Variance (ANOVA) is? No, you may not. Before discussing the overview of Anova, let me give you an example so that you can easily understand the concept of Anova and its definition.
Suppose medical researchers have three medical treatments to apply to patients with the same disease. They have recommended 10 patients to use each medication for one month who have the same condition. They measure the disease before and after the patient started using the medicine.
Thus, to understand and check the statistically significant changes in the disease, researchers use ANOVA.
However, in order to make a confident and effective decision, we need evidence to verify our approach. Here the concept of ANOVA comes.
Analysis of variance (ANOVA) is a collection of statistical models. It is one of the significant aspects of statistics. The statistics students should be aware of the analysis of variance. But most of the statistics students find it challenging to understand the analysis of variance. But it is not that difficult.
However, in this blog, we will learn about ANOVA and how we can use it.
What is Analysis of Variance (ANOVA)?
Table of Contents
Analysis of variance (ANOVA) is the most powerful analytic tool available in statistics. It splits an observed aggregate variability that is found inside the data set. Then separate the data into systematic factors and random factors. In the systematic factor, that data set has statistical influence.
On the other hand, random factors don’t have this feature. The analyst uses the ANOVA to determine the influence that the independent variable has on the dependent variable. With the use of Analysis of Variance (ANOVA), we test the differences between two or more means. Most of the statisticians have an opinion that it should be known as “Analysis of Means.” We use it to test the general rather than to find the difference among means. With the help of this tool, the researchers are able to conduct many tests simultaneously.
Before the innovation of analysis of variance ANOVA, the t- and z-test methods were used in place of ANOVA. In 1918 Ronald Fisher created the analysis of variance method. It is the extension of the z-test and the t-tests. Besides, it is also known as the Fisher analysis of variance. Fisher launched the book ‘Statistical Methods for Research Workers’ which makes the ANOVA terms well known, in 1925. In the early days of ANOVA, it was used for experimental psychology. But later on, it was expanded for more complex subjects.
The Formula for ANOVA
F= MSE/MST
where:
F=ANOVA coefficient
MST=Mean sum of squares due to treatment
MSE=Mean sum of squares due to error
What Does the Analysis of Variance Reveal?
In the initial stage of the ANOVA test, analyze factors that affect a given data set. When the initial stage finishes, then the analyst performs additional testing on the methodical factors. It helps them to contribute to the data set with consistency measurably. Then the analyst performs the f-test that helps to generate the additional data that align with the proper regression model. The analysis of methods also allows you to compare more than two groups simultaneously to test whether the relationship exists between them or not.
You can determine the variability of the samples and within samples with the results of ANOVA. If the tested group doesn’t have any difference, then it is called the null hypothesis, and the result of F-ratio statistics will also be close to 1. There is also the fluctuation in its sampling. And this sampling is likely to follow the Fisher F distribution. It is also a group of distribution functions. It has two characteristic numbers, i.e., numerator degrees of freedom and the denominator degrees of freedom.
Example of How to Use ANOVA
The researcher might use the ANOVA for various purposes. But here are a few examples of analysis of variance. The test students from multiple schools to see if the students from one school from the other schools. In the field of business application, the marketing experts can test the two different marketing strategies of the business to see that one strategy is better than the other one in terms of cost efficiency and time efficiency.
There are different types of ANOVA tests. And these tests depend on a number of factors. You can apply ANOVA when the data needs to be experimental. It is also an alternative to statistics software. But you should use it for small samples. And if you want to perform ANOVA for a large number of experimental designs, you should use the same sample size with various factors. You can test two or more variables with ANOVA. The results of ANOVA are quite similar to type I errors. The ANOVA is employed with test groups, subjects, test groups, and within groups.
Also Read
- How Statistics Math Problems Look Like & How To Solve Them
- A Comprehensive Guide On What Is Statistics In Math
- Top Most Important Application of Statistics in Daily Life
Types of ANOVA
There are two types of ANOVA.
One-way ANOVA
One way ANOVA is the unidirectional ANOVA. In this ANOVA, there are sole response variables as compared with the two-way ANOVA. It evaluates the impact of a sole factor. And this factor determines if the samples are the same or not. Besides, it is also used to determine that there is any statistically significant difference between the mean of three or more independent groups.
How to use One-Way ANOVA in Excel?
To use ANOVA in Excel, you have to install the Data Analysis Toolpak and the data that you have to analyze.
Below is a tutorial video on how to use one-way ANOVA in Excel.
Step-By-Step Tutorial on How to use One-Way ANOVA in Excel
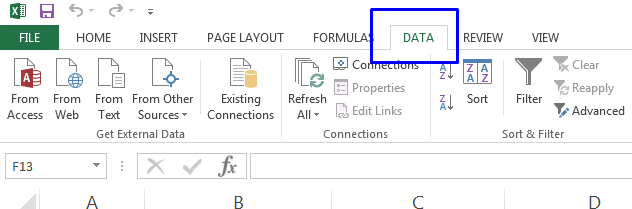
1.Click the DATA Tab

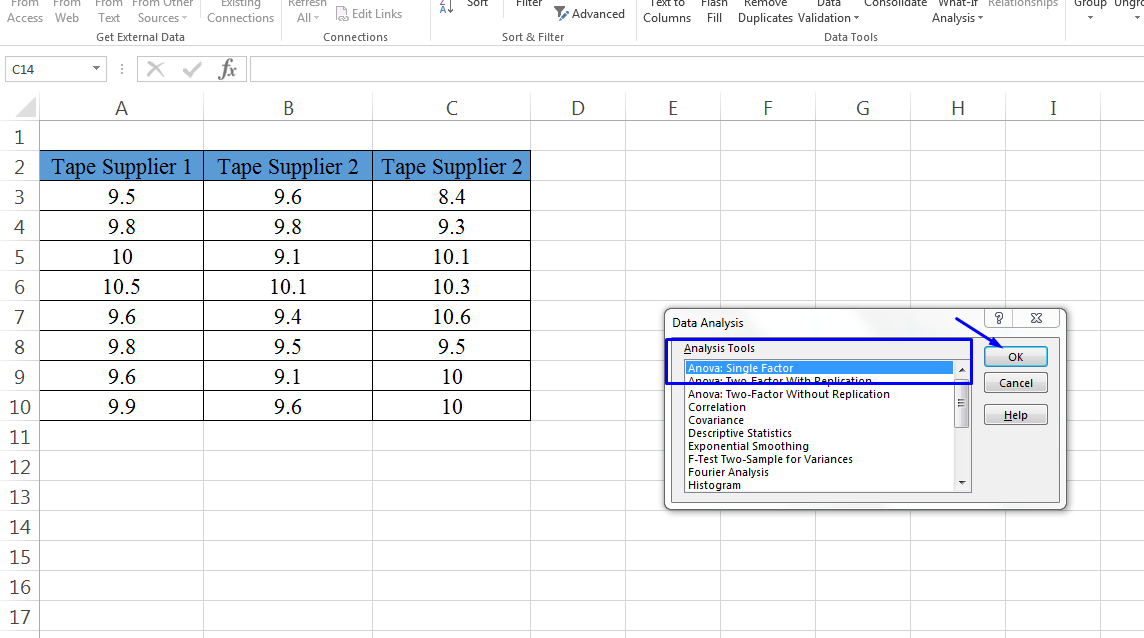
2.Click Data Analysis

3.Select ANOVA: Single Factor and click OK
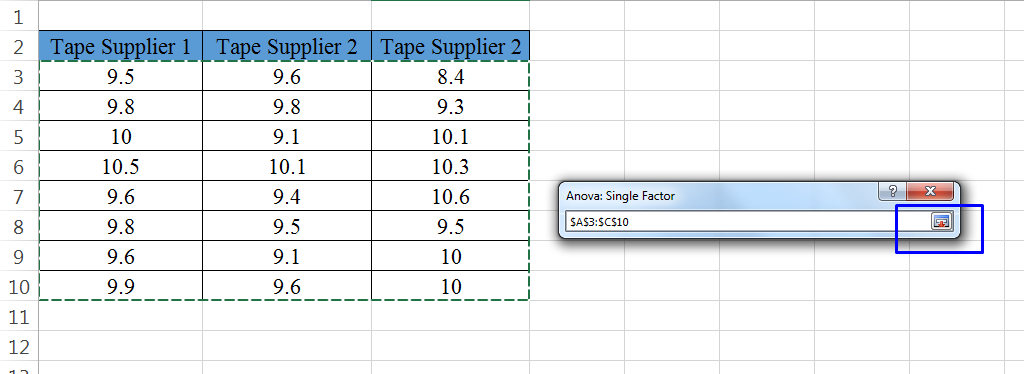
4.Next, Click the Up Arrow

5.Then, select the data and click the down arrow
6.Click OK to run analysis
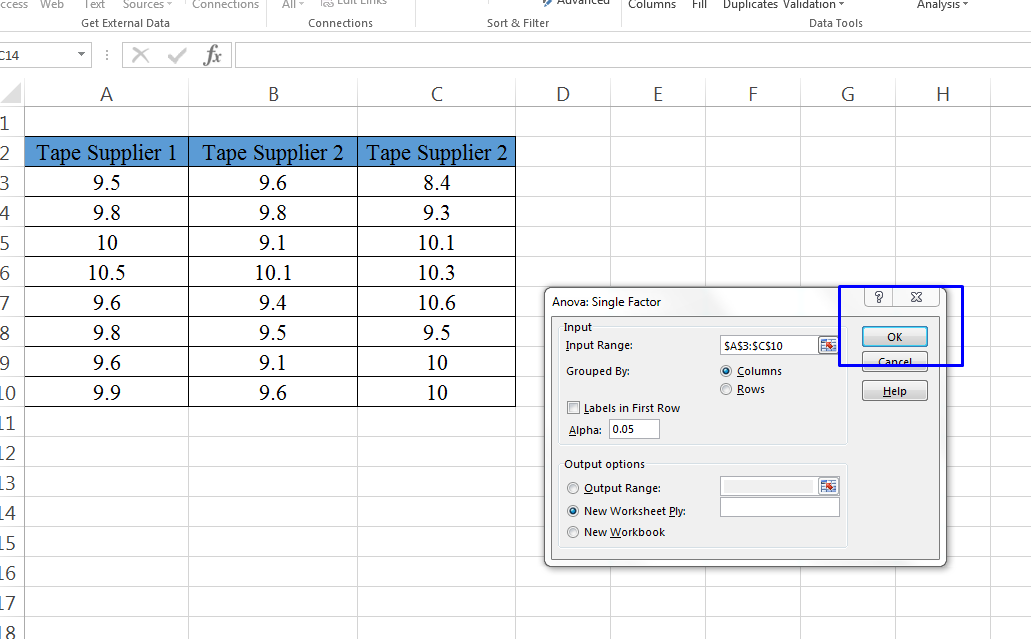
7.Then you will get your results like below.

Two-way ANOVA
A two-way ANOVA is the extended version of the one-way ANOVA. In two-way ANOVA, you will have two independents. It utilizes the interaction between the two factors. And these tests have the effect of two factors at the same time. In this ANOVA, the statistical test is used to determine the effect of two nominal predictor variables on a continuous outcome variable.
How to use Two-way ANOVA in Excel?
In two-way ANOVA, excel can be flexible with your data arrangement. But, it is strict in the case of two-way ANOVA with replication. Data for one factor must be in a different column, and data for the second factor must be in consecutive rows.
Although the use of two-way ANOVA is quite similar to the one-way ANOVA. But in this case, you have to select the ANOVA: two factors with replications.
Watch the following video to learn how to use two-way ANOVA in Excel.
Step-By-Step Tutorial on How to use One-Way ANOVA in Excel
1.Click the DATA Tab
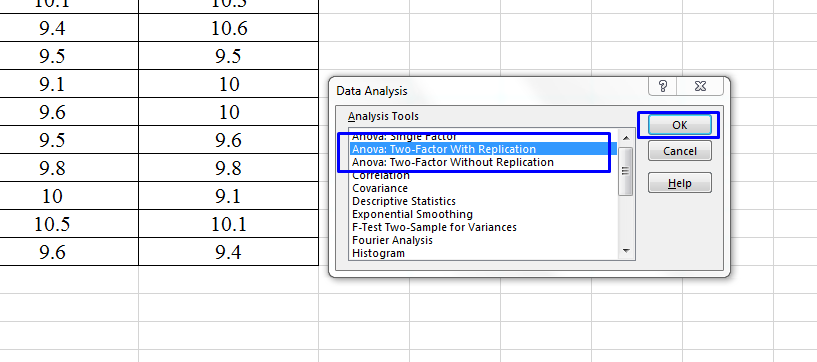
2.Click Data Analysis

3.Select ANOVA: Two Factor with Replication and click OK
4.Next, Click the Up Arrow
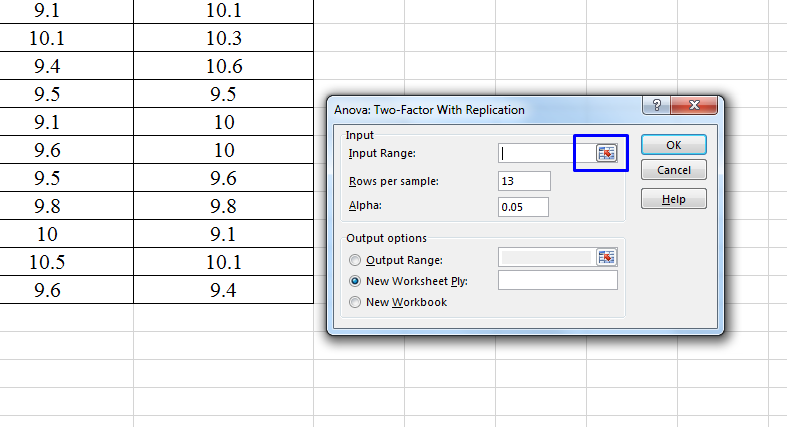
5.Then, select the data and click the down arrow.

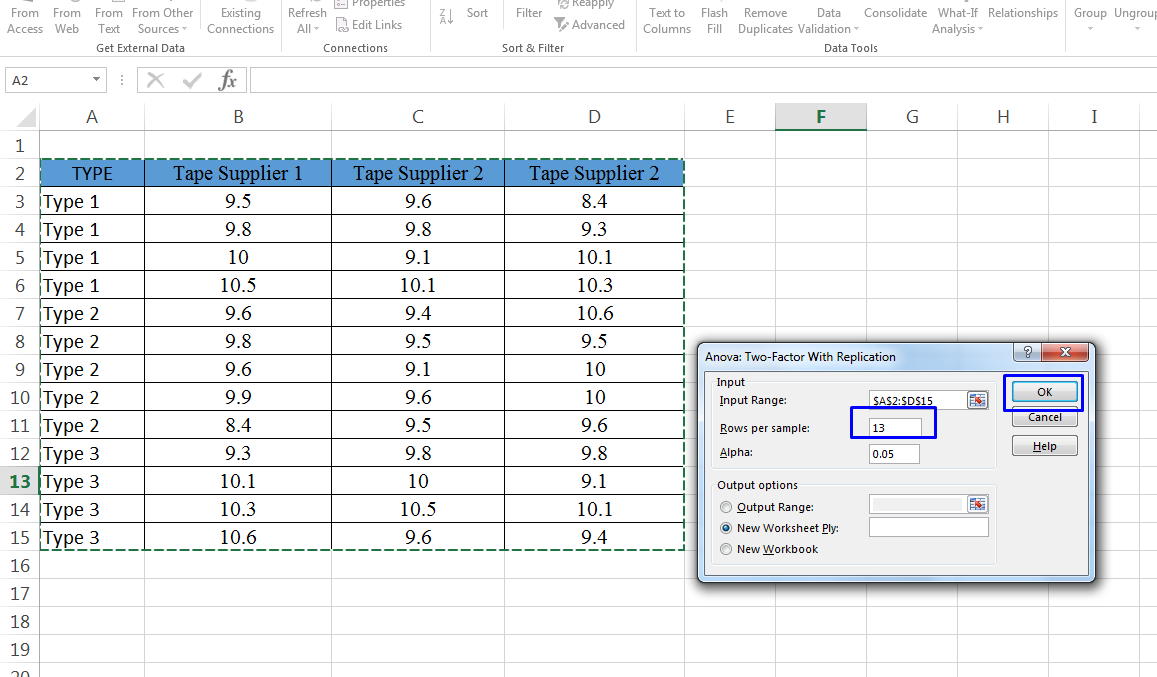
6.Select the number of rows that you want to analyse and then, Click OK.
7.Then you will get your results like below.

ANOVA Table
In the Analysis of Variance (ANOVA), we use statistical analysis to test the degree of differences between two or more groups in an experiment. Besides, we use the ANOVA table to display the results in tabular form. And this data is used to test the test hypotheses about the population mean. There are one or two ways to show the ANOVA table, depending on the various factors.
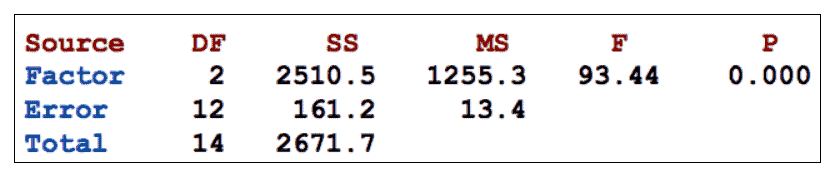
The significant columns in the ANOVA table are as follows:
1. “Source” – It means the source which is responsible for the variation in the data.
2. “DF” – degree of freedom of the data.
3. “SS”- the sum of the squares of the data.
4. “MS”- mean sum of the squares of the data.
5. “F” – F-statistic.
6. “P” – P-value.
The various row headings that are included in the ANOVA table are as follows:
1. “Factor” – It indicates the variability that results from the factor of interest.
2. “Error” – It means the unexplained random error or the variability within the groups.
3. “Total” – It is the total deviation of the data from the grand mean.
You can create the ANOVA either by hand or by using any software.
Interpretation of the ANOVA table is as follows:
In the ANOVA table, If the obtained P-value is less than or equivalent to the significance level, the null hypothesis gets automatically rejected and concluded that all the means are not equal to the given population.
Analysis of Variance Repeated Measures
Analysis of repeated measures ANOVA is the equivalent of one-way ANOVA. It is also referred to as a within-subjects ANOVA with correlated samples. It is used to detect the difference between the related means. The procedure to perform the analysis of variance designs is using the general linear models approach. It includes the three between-subject terms. The Repeated measures designs are quite popular. The reason is it allows the subject to serve as their own control. Besides, it also improves the precision of the experiment with the help of reducing the size of the error variance of the F-tests. It uses the general linear model framework to perform the calculations.
Conclusion
Researchers widely use analysis of variance. As statistics tutors, we have provided enough details here about the analysis of variance. Now you may be well aware of the analysis of variance. If you want to get good command over it, you should try to implement it in real life. But if you still find it challenging to understand the analysis in ANOVA, you can take help from us.
Frequently Asked Questions
What is the purpose of the Analysis of Variance?
An ANOVA examines the relationship between a categorical and a numeric variable by judging the differences between two or more means. This analysis gives a p-value to decide whether the relationship is vital or not.
When to use ANOVA (Analysis of Variance)?
You might use Analysis of Variance (ANOVA) as a marketer when you want to test a specific theory. You would use ANOVA to understand how your different groups react, with a null hypothesis for the test that means the various groups are equal.

