
When you go to a restaurant, you have noticed that staff are already prepared to serve you quality food even when customers arrive at a peak level. Well, this is just because of the business analytics tools.
But, how is this happening? The restaurants use tools of business analytics to speed up their order process using the drive-thru method. The manager can monitor the traffic using the analytics, and he/she is able to check the peak hours.
When he/she knows that the line is going to be long, in that time, the manager can move the staff to work for the drive-thru lane. This is how the manager easily manages the order process and helps the customer to receive their orders as soon as possible.
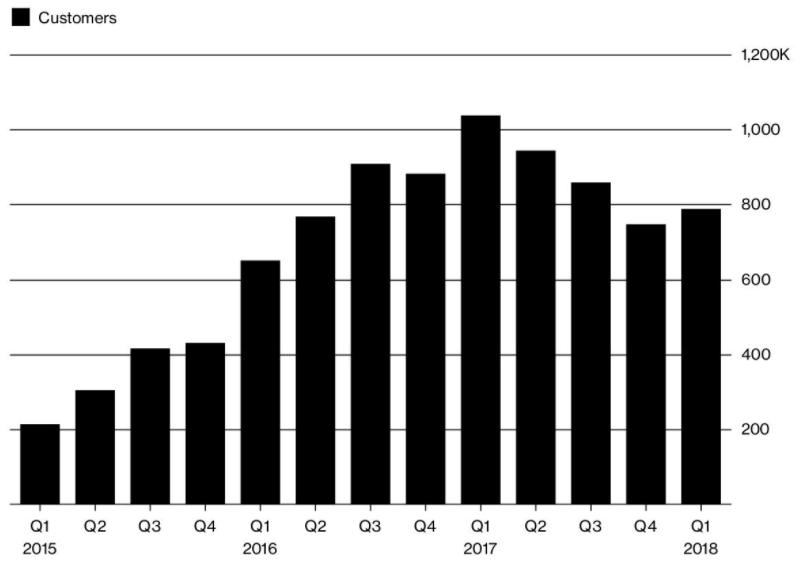
Blue Apron is a great example that uses business analytics tools to understand their customers better, enhance user experiences, forecast the shifting preferences, and even identify the change in the meal’s taste. The below graph shows the increment in the number of customers of Blue Apron from 2015-2018 (this is achieved using the BA tools and improving other factors).
Get the best business analytics assignment to clear all your doubts related to these tools.
What Is Business Analytics?
Table of Contents
- Business analytics refers to the process of analyzing data to gain information that can help businesses make informed decisions.
- Furthermore, it involves collecting and studying information to find patterns and trends that can help companies improve their performance.
- By using business analytics, you can collect data on your sales and analyze it to see which products are popular and also you can check weather your sales is increasing or decreasing.
- This information can then be used to make decisions about what products to stock, how to market them, and other strategies to help your business grow.
- In simpler terms, business analytics helps businesses use data to understand their operations and customers better, and make decisions that can improve their performance and profitability.
What Are The Key Elements Of Business Analytics?
Before moving to the essential business analytics elements, let me introduce you to what business analytics actually is. It is the combination of technologies, skills, and practices that users use to examine the data of the organization.
This helps the user to get the insights and make it possible to make data-driven decisions using statistical tools. The BA’s basic objective is to narrow the datasets to increase productivity, revenue, and efficiency.
The key elements of business analytics are:
1. Data Mining
It is the method of shifting the massive data to uncover trends, patterns, and other truths, which are not visible using statistics, machine learning, and database systems.
2. Text Mining
It is the basic process of extracting quality data from the text on different apps and worldwide.
3. Data Aggregation
It consists of collecting the information that is displayed in a summarized format.
4. Forecasting
The BA uses to analyze the process that happened during a particular season or period.
5. Data Visualization
It uses details and insights from the given data and represents it in the interactive chart or graph.
Is It Important To Use Business Analytics Tools?
It has been seen that, for starters, BA is the tool that a company needs to make relevant and exact decisions. These decisions impact the whole organization and encourage profitability, offer a great return to potential shareholders, and increase market shares.
Besides this, there are mainly 4 different ways in which the business analytics tools are important, and these are:
- Offers faster & accurate decisions.
- Encourage the changes by answering questions related to the clients.
- Enhance performance by providing a clear view of what is working and what is not for the business.
- Minimize the risk because it is useful for businesses to make the correct decisions about trends, consumer behavior, and performance.
7+ Business Analytics Tools From Beginners To Advance Level
As you get familiar with the fact that there is a need for business analytics tools, so now, let’s check the best BA tools. Below, we have listed the 7+ tools with the necessary details. You can select any of these as per your preference.
1. Board
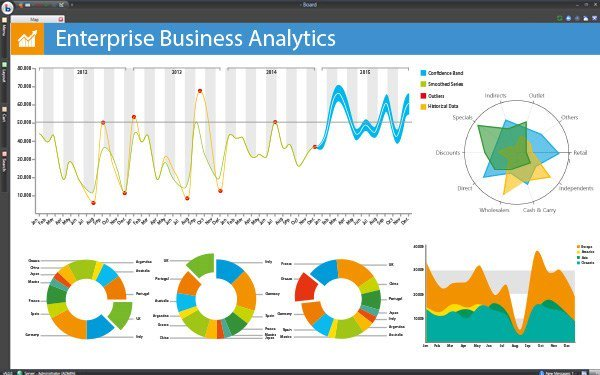
It provides advanced analytics abilities, enables the user to create interactive dashboards, reports, or analyses. The Board platform involves the BEAM automated predictive model functions. With the help of this, users can build accurate forecasting and analyses by manipulating the data feds.
Useful features:
- Dashboarding
- Reporting
- Simulation
- Planning
- Data discovery and analysis
Rating of Board BA on various factors:
- Advanced Analytics – 90
- Mobile BI – 81
- Reporting – 100
Want to learn about this tool? Here is the learning resource where you can learn about this tool. https://www.board.com/en/support
2. Sisense
Sisense is one of the dynamic and robust advanced business analytics tools. Users can easily change the unstructured data into a well-organized manner for further analysis. Moreover, the solutions enable the user to forecast the trends to promote beneficial data-driven decisions.
With this tool’s help, users can use the statistics functions like covariance, correlation, and distributions that are accessible from its dashboard directly. It has a distinctive integration with the R for statistics computations that support users to perform data visualization and data analysis.
Useful features:
- In-Chip Analytics
- Data Blending
- Interactive Dashboards
- Data Connectivity
- Data Visualizations
Rating of Sisense BA on various factors:
- Augmented Analytics – 36
- Embedded Analytics – 100
- Reporting – 92
- Data Sources Connectivity – 93
Want to learn about this tool? Here is the learning resource where you can learn about this tool. https://www.sisense.com/training/getting-started/
3. Dundas BI
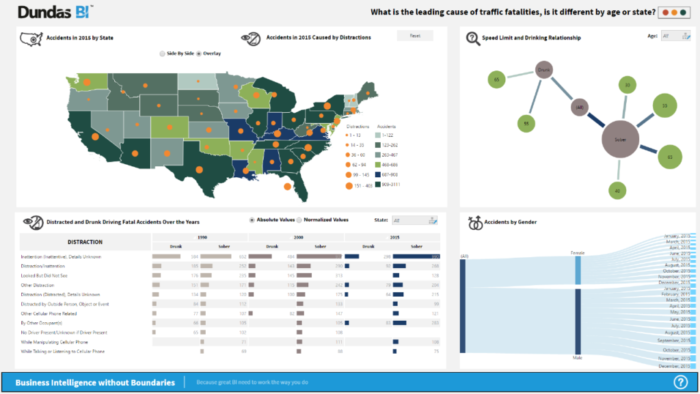
It offers access to real-time visualizations and analytics of the data and results. The solutions of this tool using an R programming language to solve complex statistical analysis. All the solutions are equipped with forecasting tools and automated analysis.
The dashboard analytics and BI give the users a structured and simple way to develop complex views. The reports can be created using drag and drop items to the report’s body, head, and footer regions. It supports both ad-hoc and automated reporting.
Useful features:
- White label BI solutions
- Embedded analytics
- Seamless user experience
- One flexible platform
- Self-service analytics
- Dashboards and reporting
Rating of Dundas BI on various factors:
- Advanced Analytics – 90
- Dashboarding and Data Visualization – 87
- Data Querying – 88
- Embedded Analytics – 80
- Reporting – 96
Want to learn about this tool? Here is the learning resource where you can learn about this tool. https://www.dundas.com/learning/training
4. TIBCO Spotfire
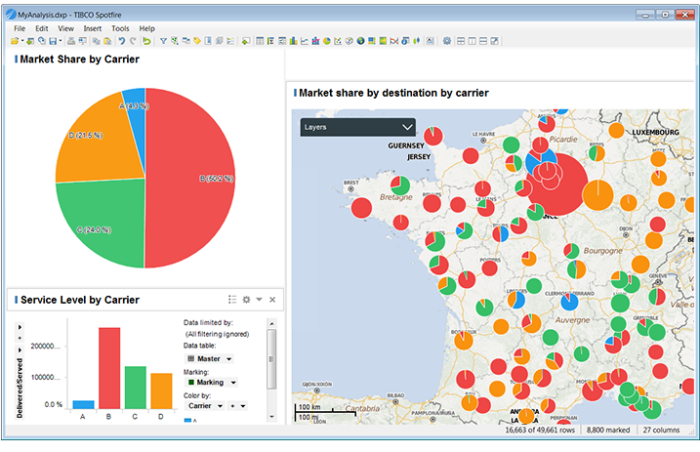
The company recently upgraded the TIBCO Spotfire platform to enhance the ability to analyze social media content and unstructured text-based data. The analytical solution support of this data analytics is just one-click forecasting.
The solutions provided by Spotfire are scalable as they can easily handle the large volume of data and numerous users without facing any issue with the quality of service. Moreover, it offers an automation service that enables users to run reports and analyses at a specific duration. The solutions encourage web analytics and enable analysis, collection, and reporting of web data.
Useful features:
- Enterprise-scale analytics
- Location analytics
- Big data analytics
- Predictive analyses
- Data discovery
- Data wrangling
Rating of TIBCO Spotfire on various factors:
- Augmented Analytics – 39
- Geospatial Visualizations and Analysis – 94
- Mobile BI – 100
- Data Sources Connectivity – 100
Want to learn about this tool? Here is the learning resource where you can learn about this tool. https://www.tibco.com/products/tibco-spotfire/learn
5. Microstrategy
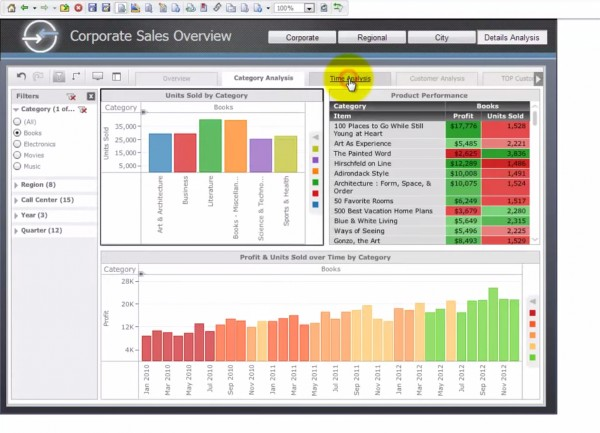
It offers advanced analytics abilities that allow users to process unstructured data in the structured data use for analysis. The solutions develop real-time predictions using native analytical abilities along with third-party data mining analyses.
Moreover, the solutions enable the users to share and build reports that are easily viewable on each device. MicroStrategy analytics has been equipped with social media and powerful web analytics.
Useful features:
- Data Connectivity
- Federated Analytics
- Data Preparation
- HyperIntelligence
- Embedded Analytics
- Machine Learning
Rating of MicroStrategy on various factors:
- Advanced Analytics – 96
- Dashboarding and Data Visualization – 90
- Embedded Analytics – 82
- Geospatial Visualizations and Analysis – 88
- Mobile BI – 100
- Reporting – 89
- Data Sources Connectivity – 93
- Security – 100
Want to learn about this tool? Here is the learning resource where you can learn about this tool. https://www.microstrategy.com/en/education
Head to head comparison of these business analytics tools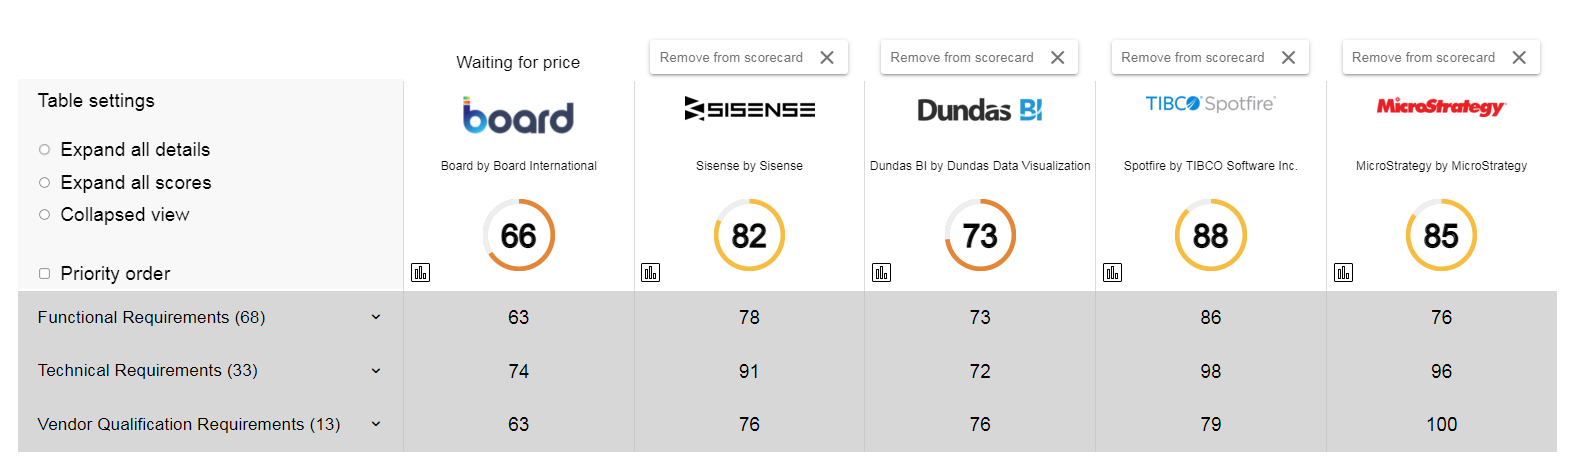 |
What Are The Benefits Of Using Business Analytics Tools?
There are many benefits of using business analytics tools which are as follows:
- By examining data, companies can make decisions that are based on facts instead of predictions.
- Many tasks can be done automatically with the help of business analytics tools, which can help you in saving time and money.
- Analytics tools can help businesses figure out how their customers act and what they like, so they can make their products and services better fit their needs.
- Companies that use analytics tools and perform Google competitive analysis can get one step ahead of their competitors by spotting trends and opportunities before they do.
So, these are some of the benefits of using business analytical tools that you can use in 2023.
Conclusion
Today, business analytics tools are in high demand. If the organization selects the best business analytics, you can make better decisions about customer experience, revenue, and overall efficiency.
Each analytical tool provider designs the tools with great usability. This helps to get the hidden points that are useful to perform better than that of competitors. Therefore, set the possible goals, keep your eye on each product price, and get surprised by what you get.
Use any of the business as mentioned above analytics tools and increase your business’s productivity by making useful decisions.
FAQs
Q1. How can business analytics tools help my business?
There are many ways of using business analytics tools in your business. Business analytics tools can help you identify patterns in track sales trends, customer behavior and monitor the performance of your marketing competetor. By providing you with insights of your performance and competetor, these tools can help you make more informed decisions, optimize your operations, and ultimately grow your business.
Q2. What are the 4 types of business analytics?
Here are the 4 types of business analytics that you must know:
1. Predictive Analytics
2. Descriptive Analytics
3. Diagnostic Analytics
4. Prescriptive Analytics

