
Statistics graphs are one of the most crucial parts of our life. Without statistics graphs, data can’t be understood by anyone. We can’t utilize different data without the use of statistics.
Therefore the significant role of statistics is to represent the data in a meaningful way. In this way, anyone can understand the data without in-depth knowledge of statistics.
Most of the time, the statistics data sets contain massive amounts of values. It is hard to represent these values in the form of lists and articles. That is why the graphs come into existence to represent the aggregate statistic value in clean and well-managed order.
Here in this blog, we will share with you the top 7 types of statistics graphs commonly used in statistics.
What is a Statistics Graph & Why Are They Used?
Table of Contents
There are various types of statistics graphs in the world. But the useful graphs are those that can convey information efficiently and effectively to the users.
Graphs are used to make the data more productive and unleash the hidden potential data. You can get an idea of the relationship between data with the help of graphs.
Apart from that, it offers you the best way to represent and conveniently compare complex data sets.
Important Point: Is there a difference between graphs and charts?
Yes, there is!!!
Although it has been observed that both are used interchangeably, there is a thin line that differentiates graphs and charts. So, keep in mind that all the graphs are used as charts, but all charts are not used as graphs.
The graphs are mathematical diagrams, which represent the relation among the two or more numeric data sets over time. In addition to it, it is useful to know that basic data is a 2-D that can be represented as curves, lines, etc.
In contrast to it, charts represent datasets that aim to make the information more understood by the users. Graphs are an excellent example of the usage of charts for data visualization.
What Are The Different Types Of Graphs?
There are various types of statistics graphs, but I have discussed 7 major graphs. Apart from this, I have discussed the advantages and disadvantages of using the particular graph. Let’s check all 7 graphs in detail.
1. Pareto Diagram or Bar Graph
A Pareto diagram is also known as a bar chart. It is the best way to represent qualitative data. It was developed in the early 1900s by Vilfredo Pareto. He used this graph to conduct his study on wealth and poverty.
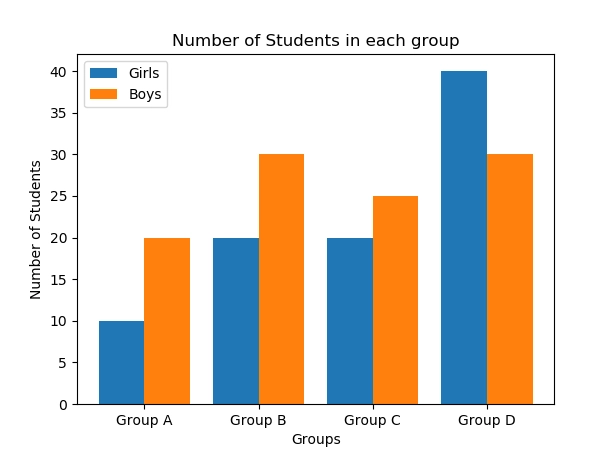
This chart offers two ways to display the data. You can either represent the data horizontally or vertically. You can use it to compare data, such as amounts, characteristics, times, and frequency.
The bar of this graph is emphasized with essential categories. You can quickly get an idea from this bar which category has the highest amount of data. There are three types of bars in this chart, i.e., single, stacked, and grouped.
| Advantage | Disadvantage |
| It enables a user to compare the data with ease. It applies strong visual impacts. | It is only used for conveying simpler. |
2. Pie Chart or Circle Graph
A circle graph is also known as a Pie chart. It is also one of the widely used statistics graphs in the world. Statisticians commonly used these graphs to represent the data graphically.
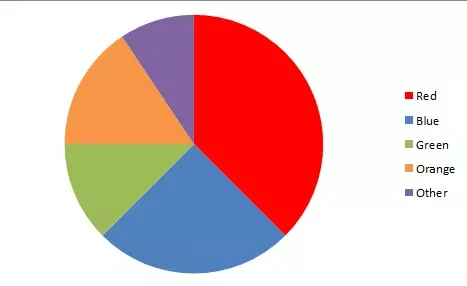
As the name suggests, this graph looks like a circular pie with a few slices. We use this type of statistics graph to represent that qualitative data.
Qualitative data means the data is not presented in numerical form. Besides, we put the different categories in each slice of the pie. The size of slices varies on the data. Some slices might be more significant, and some might be smaller.
| Advantage | Disadvantage |
| It is quite helpful to represent the ratios analysis. It provides a solid visual impact. | It is only used if the variable has few values. A single pie chart does not enable you to compare two data groups. |
3. Histogram
The histogram is another best statistics graph to represent the data. We use it to express quantitative data. In this graph, the range of values is known as classes.
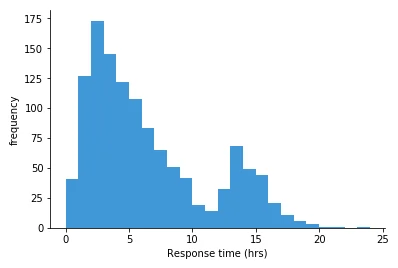
If the classes contain the lower frequencies, they would have the shorter ones containing the higher frequency. Most of the students get confused with the bar chart and the histogram because both of these look quite similar.
But these graphs are different from each other in terms of the data measurement levels. In bar charts, the frequency of categorical data is the primary factor.
While in the histogram, the data with ordinal values are the primary factor. Ordinal values are not easily measured, i.e., feelings, opinions, and suggestions.
| Advantage | Disadvantage |
| In certain conditions, the histogram is the only right approach to detail the data. It provides an idea to distribute the data in a more accurate way. | It is quite challenging to construct in case the amplitude intervals get differ. However, this problem can be solved by using graphing calculators or computers. |
Also, Read
- Most important application of statistics
- What are the misuses of statistics
- Major types of statistics terms
4. Stem and Leaf Plot
A stem and leaf plot is one of the best statistics graphs to represent quantitative data. This graph breaks each value of a quantitative data set into two pieces.
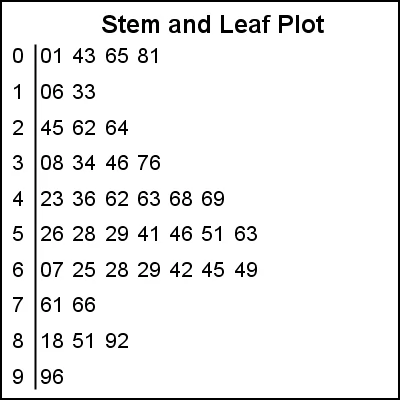
These pieces are often known as the stem and the leaf. Furthermore, the higher places values are known as the stem, and the other places values are known as the leaf.
We can list all the data values in a compact form with the help of this graph. It is a device that is used to represent the data set. It evolved in the early 1900s from Arthur Bowley’s work. Most statisticians use it for data analysis work.
| Advantage | Disadvantage |
| You can represent all the data on a single graph. Moreover, it provides a visual interpretation of distributed data. | It is not beneficial to use this graph if you have many stems. It provides less information for scattered data. |
5. Dot Plot
It is not that much of a famous statistics graph. Most experts say that it is a hybrid of the histogram and a stem and leaf plot.
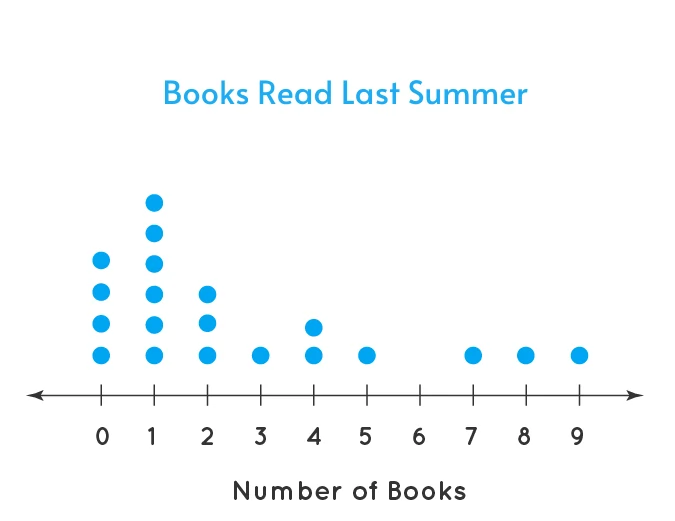
In this type of graph, each value is represented as a dot, and this dot is placed above the appropriate class. We use this graph to represent quantitative data values. Likewise, we use rectangles and bars in histograms. In the same way, we use the dots, which are joined with the help of simple lines. We use these graphs to compare the data of many individuals.
| Advantage | Disadvantage |
| It is suitable for small and moderate data sets as it highlights clusters and outliers of the data. | It is difficult to compare the number of data sets. Moreover, you can not read exact data as the data is being categorized into groups. |
6. Scatterplots
Scatterplot graphs are one of the famous statistics graphs that use in the most powerful statistics software. It is used to display data based on the horizontal axis and vertical axis.
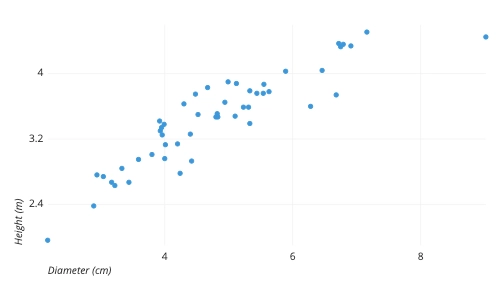
I have mentioned earlier that the statistics tools of correlation of regression are used to show trends with the scatterplot. In the scatterplot, the lines or curve is used to show the data.
This chart goes upside down and left to right. Scatter means to place the points at different places from each other. It is the statistics chart to uncover the potential of the dataset.
| Advantage | Disadvantage |
| Because of its visual size, it is possible to make relative comparisons effectively. | It isn’t very easy to determine actual values. Sometimes it is difficult to read & understand the data of a scatterplot graph. |
7. Time-Series Graphs
The time-series graph is one of the most popular statistics graphs among statisticians. It is used to represent the data points in time. It is the statistics graph that is used for a certain kind of paired data.
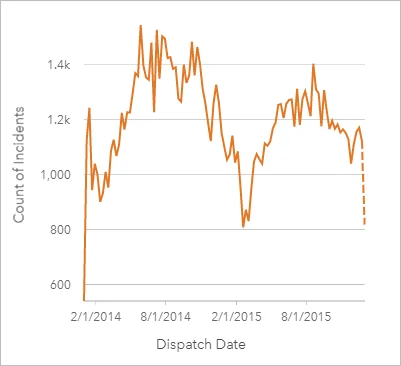
We use this graph to measure the trends over a certain period of time. Here in this statistics graph, the timeframe can contain the minutes, hours, days, months, years, decades, or even centuries.
| Advantage | Disadvantage |
| It is good to show how data gets changed over time. | Sometimes, the data change is complicated to plot because of its ups and downs result. |
How to select a perfect statistics graph as per the data?
We have already discussed that graphs can summarize large information in an easily understandable manner. Therefore, it is always necessary that you must know which is the best graph for your data.
Before selecting the graph, first, think about the purpose of the graph. Once you decide the purpose, select the variables that you need to include.
Note: Do not forget to consider the type of data that you work with.
Categorical data can group the non-overlapping categories like race, grades, or no or yes responses. Line graphs, bar graphs, and pie charts can display categorical data.
On the other hand, continuous data is measured on the continuum or scale-like test score and weight. Also, a histogram uses to represent the continuous data.
Line graphs, bar graphs, and histograms represent the data on the x-axis and y-axis. The horizontal line defines the x-axis, and the vertical line defines the y-axis.
Can I use different types of statistics graphs for different data sets?
First of all, we have to keep in mind every graph is different from the other, and we can’t use any types of statistics graphs for different types of data sets.
Therefore, we should have the proper knowledge of all kinds of statistics graphs available in the world.
Moreover, the most important thing is that the types of data always determine which figure we should use. In contrast, qualitative and quantitative data use different types of graphs. But, we can’t use the same statistics graphs for both of them.
Key Points To Remember Regarding Graphs
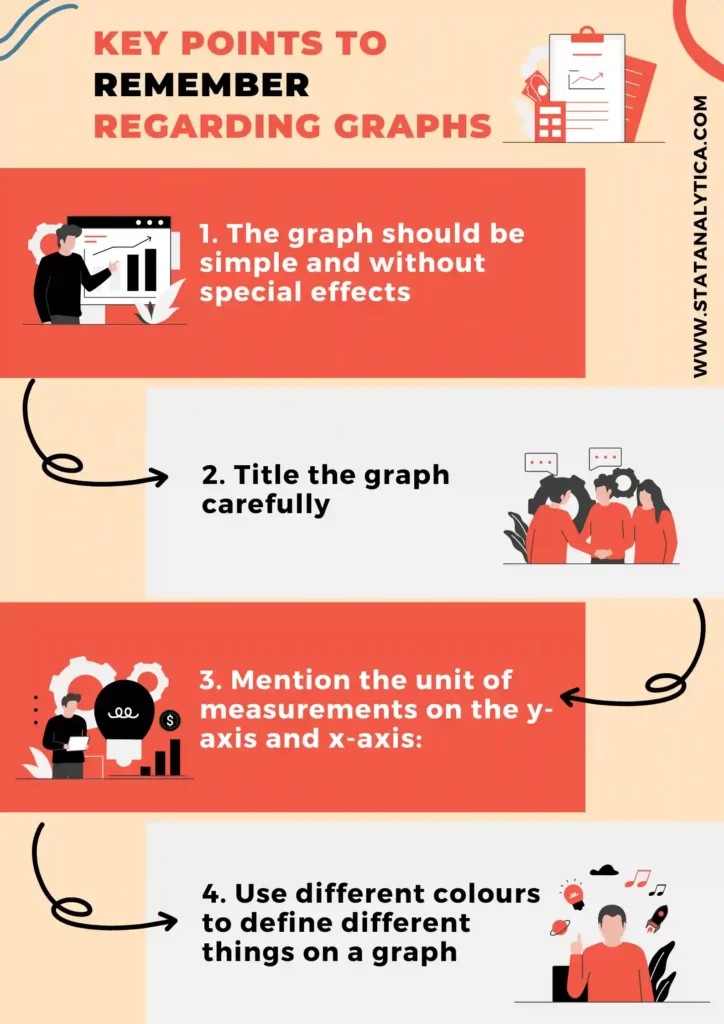
1. The graph should be simple and without special effects
Always represent the important information in a simple manner. Do not use 3-D bars as it might confuse the readers. Check the complexity of the graph, and make sure to visualize the points clearly.
2. Title the graph carefully
Double-check that the title of the graph as the x-axis or y-axis should be properly labelled and named. Titles are useful to give the readers a clear message about your topic.
3. Mention the unit of measurements on the y-axis and x-axis:
The number of participants in a program, years, and school types is some examples of the unit of measurement. Cross-check the labels to provide accurate information.
4. Use different colours to define different things on a graph
Sometimes, you need to represent the different data on a single graph. In that case, you can use varieties of colours to categorize or define the parameters. This makes your graph more understandable to the readers.
Conclusion
All these seven types of statistics graphs are the major ones. Apart from that, there are other types of statistics graphs, i.e., the statistics bar graphs, statistics, misleading graphs, and statistics line graphs.
Most statistics students are also well aware of exponentials graphs, logarithmic graphs, trigonometric graphs, cartesian graphs, and frequency distributions graphs.
Now you will be more confident about the use of graphs for different kinds of data. Finally, I would like to say that you should use the right statistics graph as per your data set. Don’t try to put the dataset into irrelevant statistics graphs. If you are still finding it challenging to choose the right graph, let our statistics homework help online experts help you in this to choose the best statistics graph for your dataset.
Frequently Asked Questions
Types of Graphs and Charts
The list of commonly used graph types is as follows:
1. Statistical Graphs ( pie graph, bar graph, line graph, etc.)
2. Exponential Graphs
3. Frequency Distribution Graph
4. Trigonometric Graphs
5. Logarithmic Graphs
What graph is best for statistics?
The line chart is considered the most used chart type. In case you have a continuous data set, then the line chart is always the best choice. These are the trending chart visualisation methods that are used over time if the data points are higher than 20 points.

