
You might have heard about NEWS channels that predict which government is going to win the election. How is it possible to know which will be the winning party? Well, it is just because of the statistical information carried out using different statistical tools.
Statistics are helpful for predicting the future outcome in different aspects of life and helpful for making useful decisions.
Suppose you are an entrepreneur and you want to expand your business in a competitive market. For that, you need to understand the market and its demanded products and services using statistical information.
After this, the market decisions can be made as per the statistics data. The right decision helps you to make maximum profit. Therefore, it is important that you must know the best and most useful statistical tools.
You might not have any idea about these tools. That is why we have provided the top 10 best statistics tools that not only help you to carry out the best statistical data but also save your time from visiting here and there for quality data. So, let’s find out the tools with their key features.
However, if you are looking for a statistics assignment helper, don’t worry you can get the best statistics assignment help from our experts. So, what are you waiting for get help now!
| “Statistics, as a tool, require proper usage, and the results obtained through statistical analysis require intelligent interpretation.” —F.C. Mill. |
Are Statistics Tools Necessary For Correct Decision-Making?
Table of Contents
If we talk about tools, it totally depends on the individual’s requirement, but it is not incorrect to say that a statistics test can be a game-changer for you. Therefore, it is necessary that you know why these tools are useful. Below are some of the important reasons for using statistics tools. Let’s check them one by one.
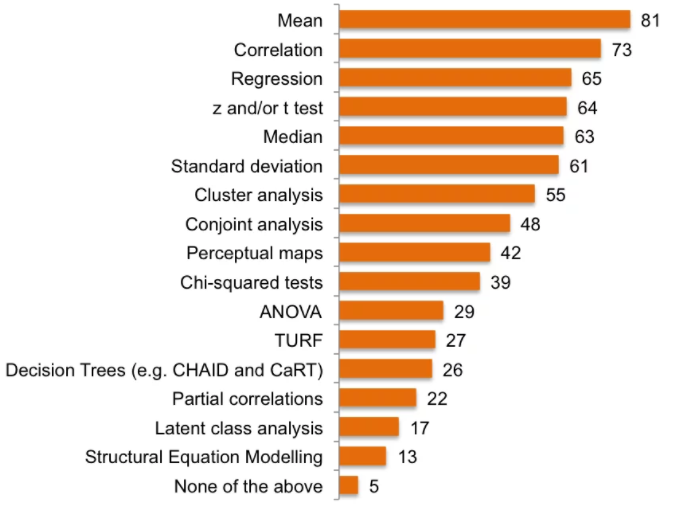
- It has been seen that most statistical approaches/tests are not that much in use. But tests like regression, t and z-tests, correlation, and cluster analysis are used for research statistics data.
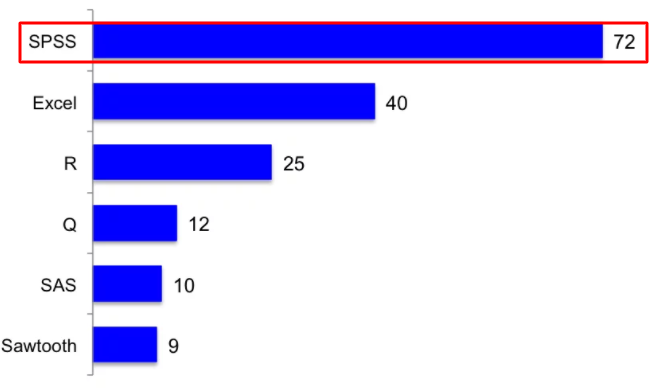
- SPSS is one of the dominating statistics tools that most statisticians use.
- Most of the integrated data collection/ analysis solutions, such as Askia, Qualtrics, Confirmit, and Vision Critical, are using statistics tools. With the help of these tools, researchers can make useful decisions. For instance, without flowing the extra steps, researchers can monitor survey flow to do important analysis.
- Apart from the below-mentioned tools, R is the most complicated statistics tool. But R offers numerous libraries to perform advanced analytics, data visualizations, and data science. Therefore, R plays an important role in performing various tasks.
These are some reasons why statistics tools are necessary for making correct decisions.
List Of Top 5 Statistics Tools Useful For Getting Data Insights!
Below are 5 statistics tools that help you to carry out the statistical data. Let’s find out their key features and important details about these tools.
1. SPSS (IBM)

SPSS is the number 1 statistics tool for human behaviour research. As the name suggests, it stands for Statistical Package for the Social Sciences. That is why the statisticians used it widely for data analysis purposes. Apart from that, you can also use the GUI for the graphical depictions of results.
You can also create a customized script for automatic analysis. It is one of the most potent statistics tools for advanced statistical processing. SPSS Inc introduced it, but later on, it was acquired by IBM in 2009. Therefore the current name of SPSS is IBM SPSS.
Key features of SPSS Statistics
- It provides better ways to analyze, and understand your data. You can also solve complex business and research problems quickly with the outstanding interface of SPSS.
- It helps you to ensure high accuracy and quality decision-making.
- You can easily integrate Python and R programming language code with SPSS.
- It also offers flexible deployment options to manage your software.
- You can also create stunning visualizations and reports with the help of a point-and-click interface. You need not have the coding experience to get started with SPSS.
- It offers the best viewing patterns of missing data and summarizing variable distributions.
- You can store the data locally on your computer with SPSS.
2. R

R is one of the best open-source statistics tools for data analytics. It is used by statisticians for research purposes. It offers excellent toolboxes that are available for a vast range of applications. R is an open-source programming language, and it has a severe learning curve.
It is not for beginners, and you need to have a good command of coding to get started with R. It was developed at Bell Laboratory by John Chambers and colleagues. R offers a wide range of statistics and graphical techniques, i.e., linear, nonlinear modelling, classical statistics test, time series analysis, and many more.
Key Features of R Programming
- R programming offers an effective data handling and storage facility,
- There is the most powerful suite of operators in R. That is used for the calculations on arrays, in particular matrices,
- It also offers the best tools for data analysis.
- R is also best for data visualization with the help of its graphical facilities for data analysis.
- It is a complete high-level programming language that includes decision statements, conditional loops, and many types of functions.
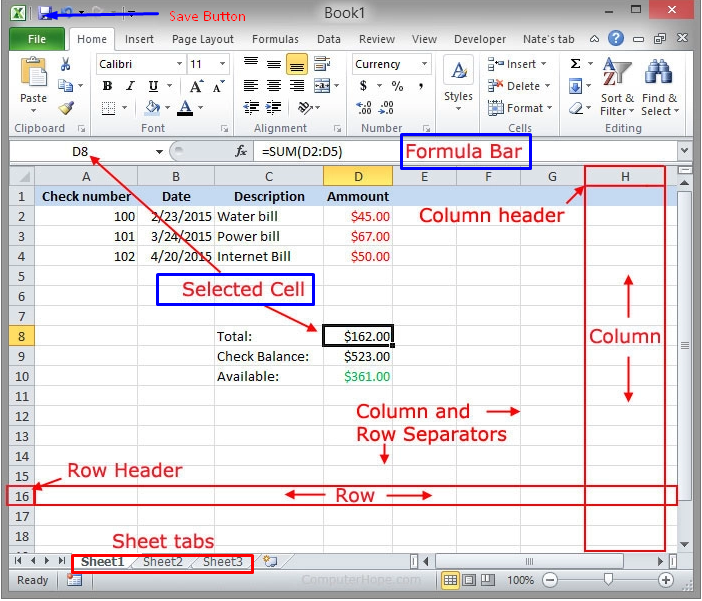
3. Microsoft Excel

MS Excel is one of the best statistical tools for data analysis. It offers cutting-edge solutions to data analytics professionals. You can use it for data visualization as well as simple statistics. Moreover, it is the best excel statisticals tools for those who want to perform basic data analysis techniques on their data.
Key Features of MS Excel
- It offers the best graphical user interface for the best data visualization solutions, and you can create many types of graphs with the help of excel.
- MS Excel offers almost every feature to perform every single data analysis operation.
- It offers you to perform necessary calculations to an advanced one.
- There are many inbuilt formulas in excel that make it also a reliable option to perform big data tasks.
- Excel allows you to manage your work. Most of the SMEs are using excel daily to run the smooth operation of their enterprises.
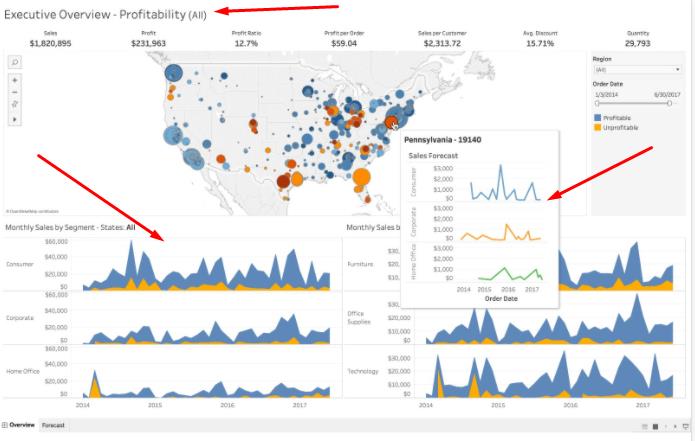
4. Tableau

Tableau is one of the most powerful data visualization software. The data visualization technique is widely used in data analytics. Now it is the part of Salesforce that is known for its high-end CRMs in the world. You can create the best data representation of the massive amount of data in Tableau within a few minutes.
Therefore it helps the data analyst to make quick decisions making. It has enormous online analytical processing cubes, cloud databases, spreadsheets, and many more. It also offers the drag and drop interface to the users. Thus the user needs to drag and drop the data set sheet in Tableau and set the filters as per their requirements.
Key Features of Tableau
- Best end-to-end analytics
- Most powerful data calculations
- Effective content discoveries
- High-end security within the system
- Work with almost every screen resolution.
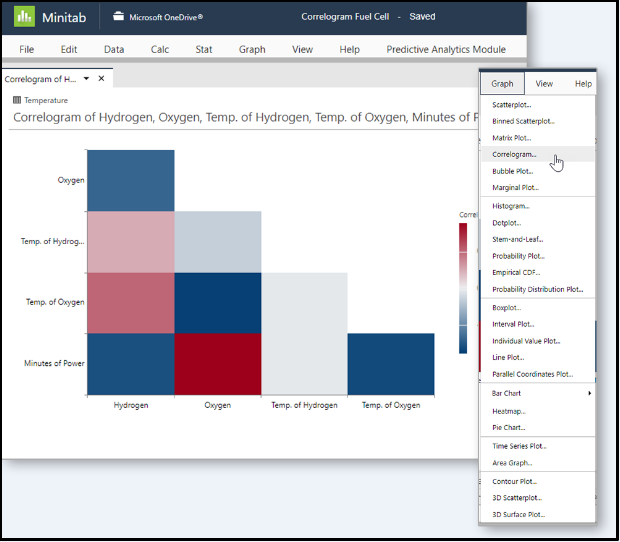
5. Minitab

It is not the most popular data analysis statistics tool. But you can do the basics as well as some advanced statistical techniques using Minitab. You can also execute commands in MATLAB with the help of GUI as well as scripted commands. It was developed in 1972 at Pennsylvania State University. The researcher Barbara F. Ryan, Thomas A. Ryan, Jr., and Brian L. Joiners are the creators of this tool. In earlier days, it was known as OMNITAB. In this way, it will enable you to find a solid answer to the most challenging questions.
Key Features of Minitab
- You can do different types of analysis using Minitab, i.e., Measurement systems analysis, capability analysis, Graphical analysis, Hypothesis analysis, regression, and so on.
- It allows you to do the best data visualization, i.e., Scatterplots, matrix plots, box plots, dot plots, histograms, charts, time series plots, probability distribution plots, etc.
- Minitab offers you to perform various statistical tests, i.e., One-sample Z-test, one- and two-sample t-tests, paired t-tests, etc.
- You can also perform regression and non-regression in Minitab.
- It is best for the analysis of variance. You can perform the ANOVA, General linear models, Mixed models, Multiple comparisons, plots: residual, factorial, contour, surface, etc.
List Of Other 5 Top Statistics Tools For Data Science
As we have already mentioned, statistics tools are also useful for data science, so let’s check them out.
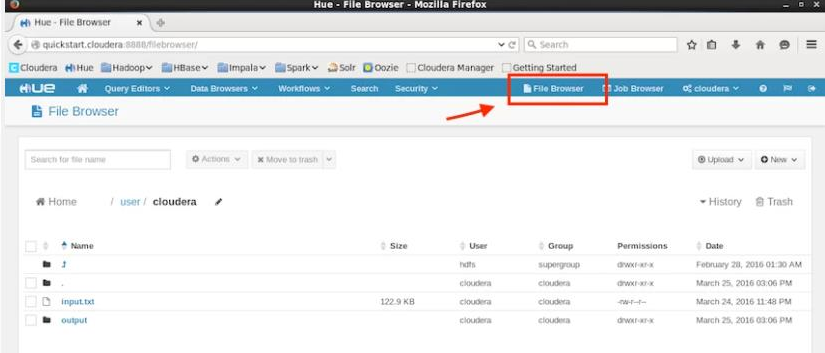
1. Apache Hadoop

Apache Hadoop is the best and most reliable statistics tool for data science. It is open-source software that is used for scalable computing. Apache Hadoop is part of the Apache software foundation under Apache license 2.0 and can solve the most complex computational problems.
It is also best at data-intensive tasks. Hadoop has the best functionality in that it doesn’t send the larger files directly to the node. It splits the large files into small chunks and then sends them over to the node with different instructions.
Key Features of Hadoop
- Hadoop is open-source software. It makes it a cost-effective tool for data science.
- Apache Hadoop has built-in features that schedule the jobs and manage the clusters automatically.
- It can easily integrate with external software and apps without any hassle.
- Apache Hadoop is quite easy to use for beginners as well. It has built in a framework that manages distributed computing with user interference.
- It has the ability to process unstructured data. Besides, it makes it an available software that allows you to perform data science operations on any type and size of data.
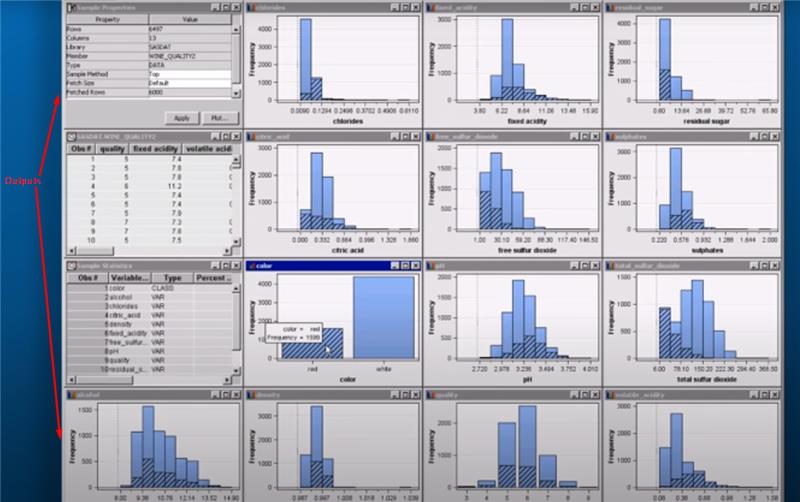
2. SAS

SAS is one of the best statistical tools for data science. It is also playing a crucial role in the data science industry. You can use it either as the GUI or create your script for the advanced level statistics analysis in data science. It can produce the best graphs and charts. You can also extend the functionality of SAS using the coding feature.
Key features offered by SAS are
- It is one of the most accessible statistics tools and provides a variety of tutorials to users.
- A variety of statistics tools are available in its suite.
- Best technical support when you need help
- High-quality and visually appealing reports
- It has the best support for spelling errors and grammar mistakes identification. That results in a more accurate analysis.
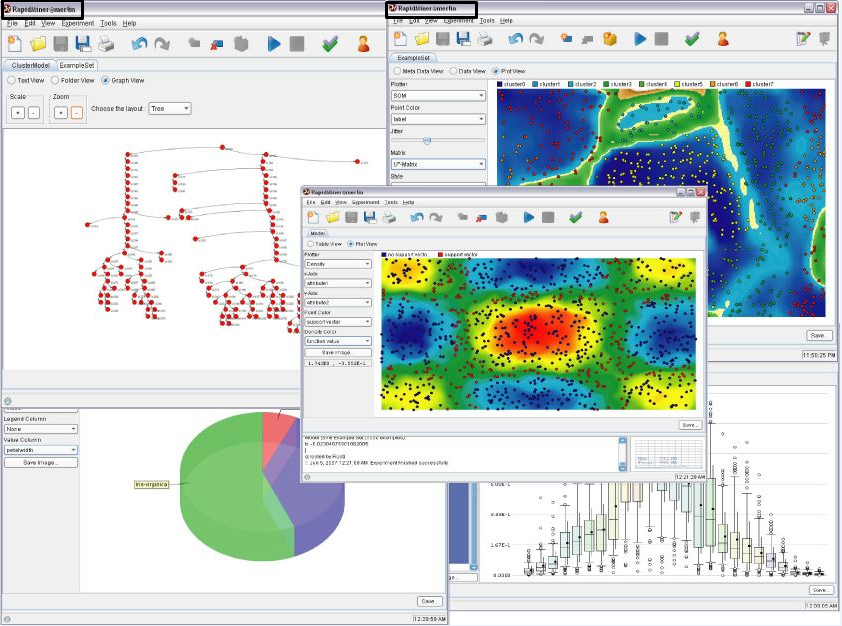
3. RapidMiner

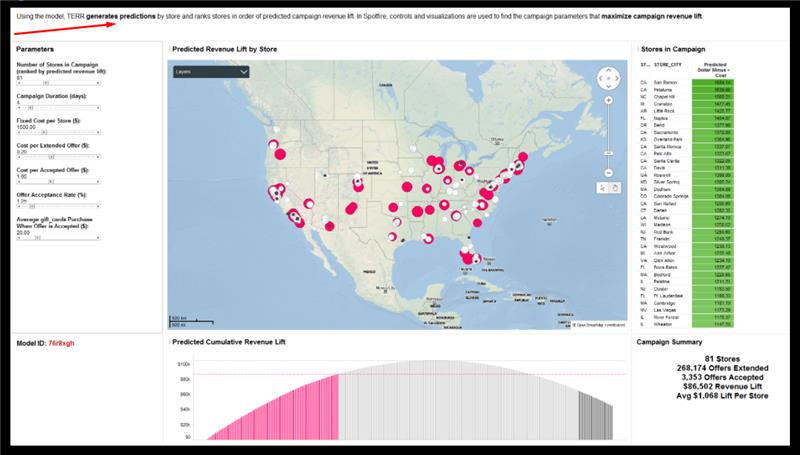
RapidMiner offers a quite helpful platform in data preparation, machine learning, and predictive model deployment. You can create the data model from the initial stage to the last step easily with RapidMiner. It offers a complete data science package. It is best for machine learning, deep learning, text mining, as well as predictive analytics. The following picture shows the visualization tools, predictive analysis, and visualization of Rapid Miner.
Features of RapidMiner
- It offers you the best platform for data preparation as well as for result visualization.
- You can expand the core functionality with the help of plugins in RapidMiner.
- It has the ability of real-time data tracking and analytics.
- It also supports various third-party integration without any hassle.
- Excellent security features.
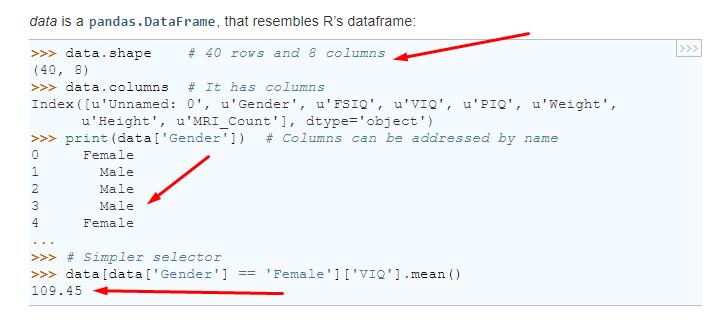
4. Python

Python is one of the best programming languages in the world. I have mentioned it in this blog because it can work seamlessly with statistics. It is the most straightforward programming language and offers lots of packages and models for statistics and data science.
Python is a high-level, general-purpose programming language created by Guido Van Rossum and released in 1991. It is the best statistics tool for data science. You can fulfil all your statistics requirements by using Python for data science. If you face trouble doing your python code, then don’t worry get instant Python Coding Help.
Key features of Python
- Some of its packages like Pandas are used for data manipulation and exploration in data science
- Matplotlib, Seaborn, and Datashader are used for stunning data visualization in Python.
- Python has built-in data storage and big data frameworks.
- SciPy is the best package for data science in Python.
- Numpy is a python library that is used to perform basic to advanced level mathematics equations.
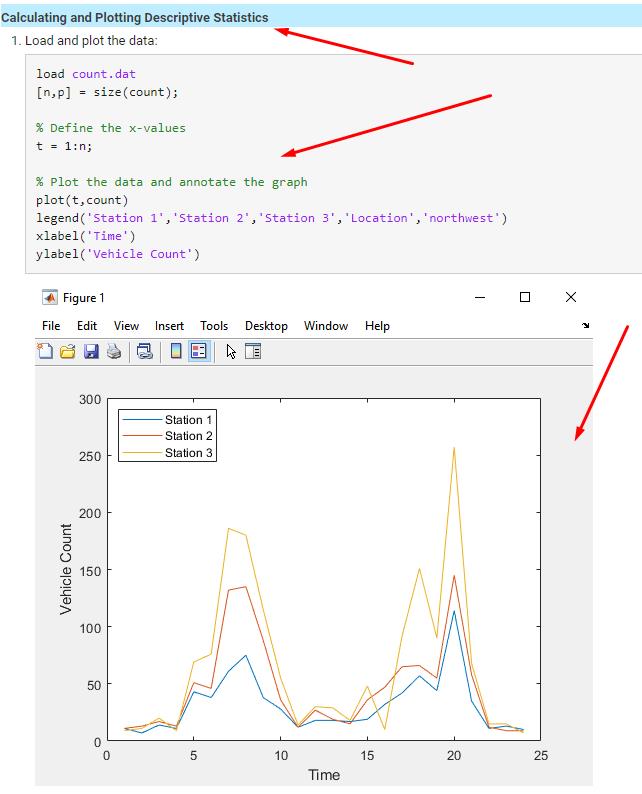
5. MATLAB (The Mathworks)

MATLAB is the best statistics analysis tool and the best statistics programming language in the world. It offers a variety of tools in its toolbox that makes it quite easy to use programming languages. You can do the most sophisticated statistical analysis with MATLAB, i.e., EEG data analysis. You can extend MATLAB functionality with the help of add-ons for toolboxes.
It offers a multi-paradigm numerical computing environment. It means that you can do procedural as well as object-oriented programming with MATLAB. It is developed by Math Works. On the other hand, if you face difficulty doing your Matlab assignment, you can get the best Matlab assignment help at a very affordable price.
It is best for matrix manipulation: data function plotting, algorithms implementations, user interface creations, and many more. You can also run the program of other programming languages with MATLAB all because of its interfacing function.
Key Feature of MATLAB
- MATLAB toolboxes are designed with perfection and professionalism. It is also rigorously tested by the tester in different conditions. Apart from that, you also get full documents with MATLAB.
- MATLAB is specially designed for production. Therefore the MATLAB code is production-ready. All you need to do is integrate the data sources and business systems into the enterprise systems.
- It has the functionality to change the MATLAB algorithms into C, C++, and CUDA cores.
- MATLAB provides the best simulation platform for users.
- It has the best environment to perform data analysis techniques.
7 Use Of Statistical Tools In Research And Data Analysis
Here are 7 common uses of statistical tools in research and data analysis:
1. Descriptive Statistics
Statistical tools such as mean, median, mode, and standard deviation are used to summarize and describe the characteristics of a dataset.
2. Inferential Statistics
These tools are used to make predictions or draw conclusions about a larger population based on a smaller sample of data.
3. Hypothesis Testing
Statistical tests such as t-tests and ANOVA are used to determine whether the data support a hypothesis about a relationship between variables.
4. Regression Analysis
This tool identifies and quantifies the relationship between a dependent variable and one or more independent variables.
5. Correlation Analysis
This tool identifies and measures the strength of a relationship between two or more variables.
6. Sampling Techniques
Statistical methods such as stratified and cluster sampling are used to select representative data samples for analysis.
7. Data Visualization
Statistical tools such as graphs and charts are used to display and communicate data clearly and meaningfully, making it easier for researchers to identify patterns and trends.
What Does A Statistician Need To Check While Analyzing The Statistical Data?
There are six major points to consider while analyzing the data. And these are:
- Source and resource of the data.
- Check the reliability of the information.
- Know the significant value of all the statistics information.
- Data’s utility is another key factor that needs to be considered for each statistics problem.
- Summarization supports statisticians to detail the key point of their statistical analysis.
- The amount of data regarding the problem that is being undertaken.
Key Point – Do I Blindly Rely Only On The Statistics Data Only
There is a well-known fact that a coin has two faces. In a similar way, statistical data can be used in positive as well as negative ways. Or we can say that anyone who has the knowledge can misuse statistics.
But when you have enough knowledge of statistics and its tools, then you can not be misguided. Therefore, you must know the methods of using these statistics tools.
Apart from this, you must cross-check the statistics data if you want to buy any service or product. This will not only help you to know the reliability of the service or product but also state its performance.
As per the statistical data, you can easily make the decision that can affect your organization and its profit. This will also help the nation to improve its economy.
Conclusion
We have seen that there are plenty of statistics tools for data analysis, data science, and data visualization. Even more statistical tools are available in the world that can fulfil your requirements for data analysis as well as data science.
Even some of the statistics tools online are an alternative to these statistics tools that I have mentioned above. But all these tools are the best in their class. Moreover, you can use any one of these tools without having a second opinion. If you are looking for how can I get help for statistics homework help, then here we are offering you the best service at nominal charges.
Frequently Asked Questions
Q1. What are the 5 basic methods of statistical analysis?
The five main methods for statistical analysis are:
1. Standard deviation
2. Hypothesis testing
3. Mean
4. Regression
5. Sample size determination
These methods are not only carried out by statisticians but also by researchers.
Q2. What are the 5 methods of collecting data in statistics?
The best 5 data collecting methods are:
1. Questionnaires and survey
2. Interviews.
3. Focus groups.
3. Observations.
4. Documents and records.

